Each - Draper Laboratory
Each - Draper Laboratory
Each - Draper Laboratory

Create successful ePaper yourself
Turn your PDF publications into a flip-book with our unique Google optimized e-Paper software.
The <strong>Draper</strong> Technology Digest (CSDL-R-3009) is published annually by The Charles Stark <strong>Draper</strong><br />
<strong>Laboratory</strong>, Inc., 555 Technology Square, Cambridge, MA 02139. Requests for individual copies or<br />
permission to reprint the text should be submitted to:<br />
<strong>Draper</strong> <strong>Laboratory</strong><br />
Media Services<br />
Phone: (617) 258-1811<br />
Fax: (617) 258-1800<br />
E-mail: techdigest@draper.com<br />
Editor-in-Chief<br />
Dr. George Schmidt<br />
Creative Director<br />
Charya Peou<br />
Designer<br />
Pamela Toomey<br />
Editor<br />
Beverly Tuzzalino<br />
Photography Coordinator<br />
Drew Crete<br />
Photography<br />
Jay Couturier<br />
Copyright © 2007 by The Charles Stark <strong>Draper</strong> <strong>Laboratory</strong>, Inc. All rights reserved.<br />
Front cover photo:<br />
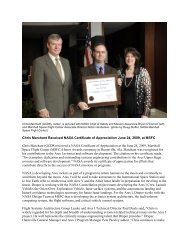
Improved accuracy of MEMS-based Inertial Navigation System achieved with coordinated gimbal<br />
movements during operational calibration updates.
Table<br />
contents<br />
of<br />
Letter from the President and CEO, James D. Shields<br />
Introduction by Vice President, Engineering, Eli Gai<br />
Papers<br />
Innovative Indoor Geolocation Using RF Multipath Diversity<br />
Donald E. Gustafson, John M. Elwell, J. Arnold Soltz<br />
Engineering MEMS Resonators with Low Thermoelastic Damping<br />
Amy E. Duwel, Rob N. Candler, Thomas W. Kenny, Mathew Varghese<br />
Improving Lunar Return Entry Footprints Using Enhanced Skip<br />
Trajectory Guidance<br />
Zachary R. Putnam, Robert D. Braun, Sarah H. Bairstow, and Gregory H. Barton<br />
A Deep Integration Estimator for Urban Ground Navigation<br />
Dale Landis, Tom Thorvaldsen, Barry Fink, Peter Sherman, Steven Holmes<br />
Error Sources in In-Plane Silicon Tuning-Fork MEMS Gyroscopes<br />
Marc S. Weinberg, Anthony Kourepenis<br />
Model-Based Variational Smoothing and Segmentation<br />
for Diffusion Tensor Imaging in the Brain<br />
Mukund N. Desai, David N. Kennedy, Rami S. Mangoubi, et al.<br />
2006 Published Papers<br />
Patents<br />
Patents Introduction<br />
Multi-gimbaled borehole navigation system<br />
Patent # 7,093,370 B2 Date Issued: August 22, 2006<br />
Mitchell L. Hansberry, Michael E. Ash, Richard T. Martorana<br />
Flexural plate wave sensor<br />
Patent # 7,109,633 B2 Date Issued: September 19, 2006<br />
Marc S. Weinberg, Brian Cunningham, Eric M. Hildebrandt<br />
2006 Patents Issued<br />
The 2006 <strong>Draper</strong> Distinguished Performance Awards<br />
The 2007 Charles Stark <strong>Draper</strong> Prize<br />
The 2006 Howard Musoff Student Mentoring Award<br />
2006 Graduate Research Theses<br />
2006 Technology Exposition<br />
2<br />
3<br />
4<br />
14<br />
24<br />
34<br />
42<br />
56<br />
70<br />
75<br />
76<br />
79<br />
82<br />
83<br />
84<br />
86<br />
87<br />
88
As <strong>Draper</strong>’s new president, it is my<br />
pleasure to introduce this year’s<br />
edition of The <strong>Draper</strong> Technology<br />
Digest. An important element of our<br />
strategy is to focus on a limited set of critical<br />
technical capabilities and to maintain our skills<br />
in these areas at a world-class level. These capabilities<br />
are:<br />
• Guidance, navigation, and control.<br />
• Autonomous air, land, sea, and space<br />
systems.<br />
• Reliable, fault-tolerant embedded systems.<br />
• Miniature, low-power electronic and<br />
mechanical systems.<br />
• Large-scale networked systems integration.<br />
• Biomedical engineering.<br />
In each of these areas, we strive to be recognized<br />
as technology leaders through innovative application<br />
of technology to solve sponsors’ problems.<br />
Technology leadership also requires that<br />
our staff share their accomplishments with the<br />
broader community by publishing, presenting<br />
at conferences, and serving on advisory boards<br />
and panels.<br />
2 Letter from the President and CEO, James D. Shields<br />
James D. Shields,<br />
President and CEO<br />
The Digest supports our efforts to encourage<br />
publishing by recognizing the authors of the best<br />
papers that were produced in the previous year.<br />
It also provides a forum to consolidate in a single<br />
volume a sampling of the technical accomplishments<br />
across the range of our critical capabilities.<br />
The six papers this year cover topics in guidance,<br />
navigation and control, microelectromechanical<br />
systems (MEMS), and biomedical engineering.<br />
All were either published in a refereed journal or<br />
presented at a prestigious technical conference.<br />
<strong>Each</strong> year, during National Engineers Week, Eli<br />
Gai, our Vice President of Engineering, presents<br />
an award to the authors of the best technical<br />
paper published in the prior calendar year.<br />
Eli also gives awards recognizing the best patent,<br />
the most effective task leader, and an outstanding<br />
mentor to students who work at the <strong>Laboratory</strong>.<br />
I congratulate the winners of these awards, whose<br />
accomplishments are described in this issue.<br />
<strong>Draper</strong>’s commitment to advanced technical education<br />
through the <strong>Draper</strong> Fellows program, where<br />
Masters and PhD candidates are supported financially<br />
and academically by allowing them to do their<br />
thesis research on a <strong>Draper</strong> project, continued for<br />
the 34 th consecutive year. We recognize this year’s<br />
graduates by listing them and their thesis titles.
Eli Gai,<br />
Vice President, Engineering<br />
This issue marks the beginning of the second<br />
decade of the <strong>Draper</strong> Technology Digest.<br />
The fundamental purpose of the Digest is<br />
to recognize the outstanding achievements<br />
of <strong>Draper</strong>’s technical staff, as reflected in the papers<br />
published and patents awarded during the most recent<br />
calendar year. The Digest also recognizes the important<br />
mentoring work performed by <strong>Draper</strong>’s technical<br />
staff by honoring the recipient of the Howard Musoff<br />
Student Mentoring Award. This year’s Digest features<br />
six excellent technical papers highlighting important<br />
hardware, software, and systems engineering achievements<br />
in support of our business areas of Space,<br />
Tactical, and Biomedical Systems. Also featured in<br />
this year’s Digest are the recipients of the Best Patent<br />
issued in 2006 and the winner of the Howard Musoff<br />
Student Mentoring Award for 2006.<br />
The first paper in this issue by Donald Gustafson, John<br />
Elwell, and J. Arnold Soltz was selected to receive<br />
the Vice President’s Award for Best Paper for 2006.<br />
In this paper, a new approach to indoor geolocation<br />
in multipath environments based on geometry-based<br />
modeling is described. Simulation results show that<br />
this approach significantly improves indoor geolocation<br />
accuracy.<br />
The second paper by Amy E. Duwel, Rob N. Chandler,<br />
Thomas W. Kenny, and Mathew Varghese<br />
describes new tools to evaluate and optimize microelectromechanical<br />
system (MEMS) structures for low<br />
thermoplastic damping. It includes an example that<br />
illustrates the use of the tools to design devices with<br />
higher quality (Q) factors, which results in improved<br />
sensor performance.<br />
The third paper by Zach Putnam, Robert Braun, Sarah<br />
Bairstow, and Greg Barton describes modifications of<br />
the skip trajectory entry guidance used in the Apollo<br />
Program for use in the planned Crew Exploration<br />
Vehicle (CEV). A simulation shows that the modified<br />
guidance significantly improves the entry footprint of<br />
the CEV for the lunar return mission.<br />
The fourth paper by Dale Landis, Tom Thorvaldsen,<br />
Barry Fink, Peter Sherman, and Steven Holmes<br />
describes optimal estimation techniques used to<br />
combine a Global Positioning System (GPS)/inertial<br />
Deep Integration algorithm with measurements from<br />
other sensors to provide accurate position information<br />
over extended missions for a personal, wearable<br />
navigation system. A field test of the system conducted<br />
under realistic GPS-stressed conditions demonstrates<br />
the practicality of the design.<br />
The fifth paper by Marc Weinberg and Tony Kourepenis<br />
describes the error sources limiting the performance<br />
of silicon tuning-fork gyroscopes (TFGs) and the techniques<br />
that can be used to minimize them. The study<br />
includes three different sensors: the Honeywell/<strong>Draper</strong><br />
TFG, the Systron Donner/BEI quartz sensor, and the<br />
Analog Device/ADXRS.<br />
The last paper by Mukund N. Desai, David N. Kennedy,<br />
Rami S. Mangoubi, Jayant Shah, Clem Karl, Andrew<br />
Worth, Nikos Makris, and Homer Pien describes the<br />
application of a unified algorithm to smoothing and<br />
segmentation of diffusion tensor imaging in the brain.<br />
Results show improvement in brain image quality both<br />
qualitatively and quantitatively, as well as the robustness<br />
of the algorithm in the presence of added noise.<br />
This year, two patents were selected for the Vice President<br />
of Engineering’s Award for Best Patent: Multi-<br />
Gimbaled Borehole Navigation System authored by<br />
Mitchell Hansberry, Richard Martorana, and the late<br />
Michael Ash, and Flexural Plate Wave Sensor authored<br />
by Marc Weinberg, Brian Cunningham, and Eric<br />
Hildebrant.<br />
Nine staff members were nominated for the Howard<br />
Musoff Student Mentoring Award, and the winner<br />
for 2006 was Laura Forrest. Details on the award and<br />
Laura’s accomplishments can be found on page 86.<br />
Introduction by Vice President, Engineering, Eli Gai 3
4<br />
Innovative Indoor Geolocation<br />
Using RF Multipath Diversity<br />
Donald E. Gustafson, John M. Elwell, J. Arnold Soltz<br />
Copyright © 2006, The Charles Stark <strong>Draper</strong> <strong>Laboratory</strong>, Inc. Presented at IEEE PLANS 2006, San Diego, CA, April 25-27, 2006<br />
Best PaPer<br />
2006<br />
abstract<br />
A new concept is presented for indoor geolocation in<br />
multipath environments where direct paths are sometimes<br />
undetectable. In contrast to previous statistically-based<br />
approaches, the multipath delays are modeled using a<br />
geometry-based argument. Assuming a series of specular<br />
reflections off planar surfaces, the model contains a maximum<br />
of three unknown multipath parameters per path that<br />
may be estimated when geolocation accuracy is sufficiently<br />
high. If some of the direct paths subsequently become<br />
undetectable, it is possible under certain conditions to<br />
maintain geolocation accuracy using only the indirect path<br />
length measurements. The new concept is illustrated via<br />
simulation using a relatively simple representative scenario.<br />
Performance is compared to a traditional method that uses<br />
only direct path measurements, indicating the potential<br />
for significantly improved indoor geolocation accuracy<br />
in environments dominated by multipath. Since the estimated<br />
multipath parameters are geometry-dependent, this<br />
approach allows the possibility of building up indoor map<br />
information as the geolocation process commences.<br />
Introduction<br />
A number of approaches have been suggested for locating<br />
and tracking people and objects inside buildings where<br />
Global Positioning System (GPS) operation is denied.<br />
Most of these use radio frequency (RF) phenomena and<br />
are limited in performance by a single phenomenon: RF<br />
multipath. Performance has relied on the ability to determine<br />
the direct path distance from a number of reference<br />
sources to the person or object of interest. Within indoor<br />
environments, the received signal strength of indirect paths<br />
is often greater than the direct paths, sometimes resulting<br />
in undetected direct paths and detected indirect paths. [1]<br />
In these situations, methods based on direct paths cannot<br />
maintain accurate tracking over a period of time, particularly<br />
when the object being tracked moves in an unpredictable<br />
fashion. This limitation can be overcome in some<br />
cases by exploiting the geolocation information contained<br />
in the indirect path measurements.
This paper presents a new solution to this problem. Rather<br />
than treating multipath signals as noise and attempting to<br />
mitigate multipath-induced errors, this technique exploits<br />
the multipath signals by using them as additional measurements<br />
within a nonlinear filter. The nonlinear filter uses<br />
simultaneous indirect and direct path measurements to<br />
build up parametric models of all detected indirect paths.<br />
If one or more direct paths are subsequently lost, the<br />
nonlinear filter is able to maintain tracking by navigating<br />
off the indirect path measurements. Previous approaches<br />
to indirect path length modeling have relied on statistical<br />
models (e.g., direct-path length plus bias). In contrast,<br />
our approach is geometry-based. Of importance is the fact<br />
that the indirect path distance after a sequence of specular<br />
reflections off planar surfaces can be modeled exactly<br />
using only two parameters in two dimensions and three<br />
parameters in three dimensions, for any number of reflections.<br />
These parameters are estimated in real time in the<br />
nonlinear filter.<br />
Problem Formulation<br />
A typical indoor multipath RF signature is shown in Figure<br />
1, assuming a bandwidth of 200 MHz. [2] Received signal<br />
amplitude is plotted vs. time delay. The direct path amplitude<br />
is below the detection threshold, while the amplitude<br />
of several indirect paths is higher than threshold. In particular,<br />
the strongest path is the first indirect path, which<br />
results in an error of 5.3 m for a geolocation system based<br />
on direct path measurements.<br />
Amplitude (mU)<br />
1.4<br />
1.2<br />
1<br />
0.8<br />
0.6<br />
0.4<br />
0.2<br />
Dynamic Range<br />
Error<br />
Detection<br />
Threshold<br />
Strongest Path<br />
BW = 200 MHz<br />
Distance Error = 5.3247 m<br />
0<br />
0 20 40 60 80 100 120 140<br />
Time (ns)<br />
Figure 1. Typical indoor multipath RF signature.<br />
Indoor Geolocation System Architecture<br />
The architecture for the indoor geolocation system under<br />
consideration is shown in Figure 2. Without loss of generality,<br />
we consider the problem of tracking a single transponding<br />
tag. The space is instrumented with multiple RF<br />
sources at known and fixed locations (nodes). Means are<br />
available to identify the RF source without error. The signal<br />
received at a node after reception and retransmission from<br />
the tag is modeled as<br />
,<br />
where z(t) is the transmitted signal, subscript i refers to the i th<br />
path, (i = 0 is the direct path, and i > 0 is an indirect path),<br />
a i (t) is the complex attenuation factor, t i (t) is the path<br />
delay, n(t) is noise, m is the number of indirect paths, and<br />
t d is the processing delay within the tag, which is assumed<br />
to be known. The direct path delay is t 0 (t) = ||r(t)-s||/c,<br />
where r(t) is the tag location, s is the node location, and c<br />
is the signal propagation speed.<br />
Received<br />
Signal<br />
Preprocessor<br />
Data<br />
Association<br />
Nonlinear<br />
Filter<br />
Tag<br />
Position<br />
Path<br />
Delays<br />
Persistent<br />
Paths<br />
Figure 2. Geolocation system architecture.<br />
The differential delay is the excess delay of the indirect<br />
path relative to the direct path:<br />
dt i (t) = t i (t) − t 0 (t) > 0 ; i = 1,2,...,m.<br />
A preprocessor is used to estimate all detected path delays. A<br />
number of methods have been developed for this purpose.<br />
In Reference [3], the received signal was modeled as the<br />
sum of the direct-path signal and a delayed version (one<br />
indirect path), with the indirect path amplitude less than<br />
the direct path amplitude. Using a first-order finite impulse<br />
response filter model, the differential delay and indirect<br />
path amplitude were estimated using the autocorrelation<br />
of the received signal. Another approach [4] used maximum<br />
likelihood to estimate the direct path delay in a multipath<br />
environment. In Reference [5], multipath measurements<br />
were used to increase the accuracy of the direct path delay<br />
estimate. This method required an a priori statistical model<br />
of indirect path delay statistics. Differential delays were<br />
modeled as biases in Reference [6], and algorithms were<br />
developed for multipath detection and bias estimation. In<br />
Reference [7], the known autocorrelation function within<br />
a GPS receiver was used for multipath mitigation. In Reference<br />
[8], GPS differential delays were estimated using a<br />
multiple-hypothesis Kalman filter. Differential delays were<br />
modeled as biases in Reference [9], and a particle filter<br />
was used for joint estimation of bias and tag location in an<br />
Innovative Indoor Geolocation Using RF Multipath Diversity 5
indoor environment. The statistical bias model was generated<br />
using ultra-wideband measurements.<br />
In practice, it is important to correctly associate each calculated<br />
delay with the direct path or a specific indirect path<br />
(i.e., a specific sequence of reflections off the same set of<br />
reflecting planes). This is not a straightforward process in<br />
some scenarios with multiple nodes and complex environments<br />
containing many reflecting surfaces of various<br />
orientations and size. The problem is made challenging by<br />
the presence of crossovers between pairs of time delays,<br />
appearance of new paths, disappearance and reappearance<br />
of existing paths, and the presence of noise. In order to be<br />
effective, the data association algorithm should be capable<br />
of detecting path persistence, so that the largest possible<br />
number of measurements for each path are obtained; this<br />
enhances the accuracy of multipath parameter estimation.<br />
All the methods mentioned above rely on a single parameter,<br />
the differential delay, for the multipath model.<br />
Multipath estimation is based on a priori statistical models<br />
of differential delay, typically as a bias (including means to<br />
detect sudden bias changes) or output of a low-order linear<br />
filter. In contrast, the approach suggested here is based on<br />
a geometrical model and the assumption that the indirect<br />
path length is the result of a series of specular reflections<br />
off planar surfaces. This model contains several geometrybased<br />
parameters and does not depend on a priori statistical<br />
models of multipath delay. Thus, use of this model allows<br />
the possibility of inferring geometrical structure within the<br />
indoor environment. We now develop the measurement<br />
model that is appropriate for use in a nonlinear filter that<br />
is capable of joint estimation of tag location and the geometry-based<br />
multipath parameters.<br />
Geometry-Based Measurement Model<br />
In the following, time delays have been converted into<br />
distances using the known signal propagation velocity in<br />
air. The indirect path distance after a sequence of m specular<br />
reflections off planar surfaces is derived as follows.<br />
Referring to Figure 3, the relevant equations are, for i =<br />
1,2,...,m<br />
and<br />
where p i is the specular point on the i th plane, d 1 is the<br />
distance from the source to p 1, {d i ; i = 2,3..., m} is the<br />
6 Innovative Indoor Geolocation Using RF Multipath Diversity<br />
(1)<br />
(2)<br />
(3)<br />
(4)<br />
(5)<br />
(6)<br />
distance from p i−1 to p i , d m+1 is the distance from p m to r, w i<br />
is the unit vector along the incident ray, b i is the distance of<br />
the plane to the origin of the navigation frame, u i is the unit<br />
vector normal to the plane, and d is indirect path length.<br />
From (1), (5), and (6),<br />
Thus,<br />
From (3) and (4),<br />
Thus,<br />
But, from (1) and (2),<br />
p 1<br />
tag r<br />
w m<br />
q 1<br />
q 1<br />
d m+1<br />
u m<br />
d 1<br />
Figure 3. Geometry for m specular reflections.<br />
w 2<br />
u 1<br />
d m<br />
q m<br />
q m<br />
w m+1<br />
w 1<br />
source s<br />
p m<br />
(7)<br />
(8)<br />
(9)<br />
(10)<br />
(11)
Thus<br />
Continuing, we find that<br />
(12)<br />
(13)<br />
By induction, we see from (8), (12) and (13) that for<br />
k=1,2,…,m+1<br />
The case of most interest is k = 1, which gives<br />
which can be written in the form<br />
where<br />
(14)<br />
(15)<br />
(16)<br />
(17)<br />
is a scalar offset distance that contains contributions from<br />
all m reflections. In (16), wm+1 is the unit vector from the<br />
last specular point to the tag and contains potentially useful<br />
information regarding the geometry of the indoor space.<br />
The multipath parameters {wm+1 , cm } vary as the tag moves<br />
through the indoor space. If the variations are too large,<br />
the parameters may be essentially unobservable, resulting<br />
in poor performance. Generally, the variations decrease as<br />
the node moves away from the tag. To see this, write (5)<br />
in the form<br />
where<br />
(18)<br />
Then<br />
and<br />
Since M 1 depends only on the orientation of the reflecting<br />
planes, w m+1 becomes independent of r as . Similarly,<br />
from (17),<br />
so that<br />
(19)<br />
Thus, cm also becomes independent of r as . For typical<br />
indoor environments and tag motion, parameter values<br />
are generally stable enough to allow reasonable tag localization<br />
accuracy. A representative example is given in the<br />
sequel to illustrate this point. An important limiting case<br />
is the problem of navigation using GPS measurements in<br />
the presence of multipath. The distance to the nodes (GPS<br />
satellites) is essentially infinite and the multipath parameters<br />
are constant over sufficiently short periods of time<br />
where the effects of satellite motion may be ignored. This<br />
considerably simplifies the problem of navigating using<br />
GPS measurements in multipath environments.<br />
The indirect path parameter set {wm+1, cm} contains three<br />
unknown parameters in three-dimensional space and two<br />
unknown parameters in two-dimensional space. Importantly,<br />
the form of (16) is independent of the number of<br />
reflections, although the offset distance is significantly<br />
different. Hence, it does not matter that the number of<br />
reflections is unknown in practice, and the accuracy of<br />
estimating {wm+1 , cm } is not affected by the number of<br />
reflections. For this reason, the reflection subscript m is<br />
dropped in the sequel.<br />
Multipath Geolocation system Design<br />
Equation (16) is in the form of a bilinear measurement<br />
equation that can be handled using appropriate recursive<br />
nonlinear filtering methods in which the goal is to track the<br />
tag location r and estimate the multipath parameters {w, c}<br />
simultaneously by processing a sequence of noisy measurements<br />
of d as the tag moves through the indoor space. Note<br />
that this model includes the unknown effects of additional<br />
path delays associated with attenuation through materials<br />
in which the signal propagation speed is slower than in<br />
air.<br />
If the parameters are known exactly, then (16) is in the form<br />
of the usual linear measurement equation for a Kalman<br />
filter. If the parameter uncertainties are small enough, then<br />
tag position can be estimated with reasonable accuracy<br />
using an extended Kalman filter. In some practical situations,<br />
the uncertainty associated with the initial parameter<br />
Innovative Indoor Geolocation Using RF Multipath Diversity 7
estimates may be large enough to preclude the initial use of<br />
an extended Kalman filter, and other means (e.g., particle<br />
filters, multiple-hypothesis filters, information filters) must<br />
be used at least initially to get within the linear range of an<br />
extended Kalman filter.<br />
The form of (16) indicates that accurate estimation of the<br />
multipath parameters {w, c} depends on meeting several<br />
conditions: 1) relatively accurate tag location estimates<br />
over a sufficient length of time, 2) tag motion sufficient to<br />
ensure observability of the parameters, 3) relatively small<br />
variation of the of multipath parameters as the tag moves<br />
through the indoor environment, and 4) persistence of<br />
the sequence of reflections. In the sequel, it is shown for a<br />
representative indoor scenario that the parameter variations<br />
tend to be relatively small as the tag moves through space,<br />
allowing reasonably accurate estimates of the multipath<br />
parameters to be obtained.<br />
Data Association<br />
A generic measurement data association algorithm is<br />
depicted in Figure 4. At any time, data for all current and<br />
past detected indirect paths are stored, both as all past raw<br />
measurement associated with that path and the coefficients<br />
of low-order ordinary least squares regression models of<br />
the path delays. When a new measurement is obtained,<br />
the distance to all current paths is calculated by comparing<br />
the predicted values in the current database with the<br />
new value. If the minimum distance is less than a prespecified<br />
threshold, then the closest current path is updated,<br />
including the regression model. If the distance exceeds the<br />
threshold, a new indirect path is started. Note that new<br />
indirect paths may be started if a new path appears, an old<br />
path reappears, or a current path changes by a relatively<br />
large amount due to tag motion since the last measurement<br />
of that indirect path. The output of the data association<br />
algorithm is the identity of the path associated with the<br />
current measurement.<br />
Step 1<br />
Step 2<br />
New<br />
measurement<br />
(y)<br />
Start new path<br />
Prediction based on<br />
OLS path model<br />
Find distance to current<br />
closest path<br />
Figure 4. Generic measurement data association<br />
algorithm.<br />
8 Innovative Indoor Geolocation Using RF Multipath Diversity<br />
no<br />
d, k<br />
d 0 is used in the filter to model the uncertainty<br />
associated with the unknown control u(i − 1).<br />
From (16), the indirect path length measurements are<br />
modeled as<br />
,<br />
,<br />
(22)<br />
where n(i) is zero-mean Gaussian measurement error.<br />
Updating at a measurement is performed using the extended<br />
Kalman filter update equations (cf., Reference [11])<br />
where<br />
(23)<br />
is the measurement residual and K(i) is the optimal gain<br />
matrix:<br />
where<br />
(24)
and s n(i) is the rms measurement error.<br />
In case the parameters are assumed to be completely<br />
unknown initially, it is necessary to initialize the parameter<br />
estimates and the associated error covariance matrix<br />
using the first several measurements. This is accomplished<br />
using the information form of the Kalman filter. [12] Let a<br />
denote the parameter vector: a T (i) = [w T (i) c(i)] and write<br />
the measurement equation as<br />
(25)<br />
Assume that the first k measurements are direct path<br />
measurements resulting in accurate estimates of tag position<br />
and let<br />
Then, using the recursion,<br />
the initialization is:<br />
.<br />
(26)<br />
(27)<br />
(28)<br />
Direct path measurements are processed using the<br />
extended Kalman filter equations with x = r, h(x) =<br />
.<br />
Estimates of the multipath parameters and covariances are<br />
unchanged.<br />
example<br />
A relatively simple two-dimensional example is presented<br />
here to demonstrate the potential effectiveness of the<br />
proposed approach. The performance of two filters was<br />
compared: 1) the multipath filter, and 2) a conventional<br />
extended Kalman filter, which operates on direct path<br />
measurements only. A single RF transponding tag is moving<br />
within a 30 x 30-m area with planar walls. The initial conditions<br />
are shown in Figure 5. Two fixed RF nodes at known<br />
locations are located at adjacent corners of the space. It<br />
is assumed that the signal attenuation associated with a<br />
reflection is large enough to preclude detection of signals<br />
resulting from more than one reflection. Multipath signals<br />
are thus created by a single specular reflection off either a<br />
side (East/West) wall or the South wall. A single 5 x 10-m<br />
rectangular object is located within the room, which blocks<br />
all RF signals. The geometry in Figure 5 shows the direct<br />
paths (solid black lines) and the indirect paths (dotted<br />
black lines) to the transponding tag from the two nodes.<br />
The two direct paths are unblocked. The two indirect paths<br />
resulting from reflection off the East and West walls are<br />
also unblocked; however, the two indirect paths resulting<br />
from reflection off the South wall are blocked.<br />
North (m)<br />
Node 1 Node 2<br />
30<br />
25<br />
20<br />
15<br />
10<br />
5<br />
0<br />
x1t0<br />
0 10 20 30<br />
East (m)<br />
Figure 5. Example: initial conditions.<br />
A particle filter was used initially to reduce the geolocation<br />
uncertainty to within the linearization region of<br />
an extended Kalman filter. A total of 25 particles was<br />
assumed, with the particles initially distributed uniformly<br />
within the room (black “x” in Figure 5). The initial 1-sigma<br />
error ellipse is shown by the dotted red circle. Initialization<br />
was accomplished by sequential processing of one direct<br />
path measurement from each of the two nodes (solid black<br />
lines) at the initial time. A standard sequential importance<br />
sampling algorithm [10] was used, with the normalized<br />
importance weights proportional to the measurement<br />
likelihood function. The rms measurement error was s n<br />
= 1 ft. Since there were relatively few particles and the<br />
measurement error was much smaller than the initial position<br />
uncertainty, the first particle filter update yielded<br />
only two unique particle locations (population = 10 and<br />
15), an example of the well-known problem of particle<br />
impoverishment. A simple spreading algorithm was used<br />
to increase particle diversity. The particles at each location<br />
were spread by sampling from a Gaussian distribution with<br />
an rms value of 1.5 m/axis. The same process was followed<br />
after updating using the measurement from Node 2.<br />
The results of the initialization procedure are shown in<br />
Figure 6. Both filters were initialized with the same estimates.<br />
The particle mean was used to initialize the tag position<br />
estimates to<br />
meters, while the tag position error covariance matrices<br />
were initialized to P(1) = 0.09 I 2 meter 2 , in agreement<br />
with the assumed rms measurement error. The maximum<br />
dispersion of any particle from the true tag location was 5.7<br />
m, so that the dispersion of the particles was reduced to<br />
the point where initialization of the extended Kalman filter<br />
could be performed.<br />
Innovative Indoor Geolocation Using RF Multipath Diversity 9
North (m)<br />
Node 1 Node 2<br />
30<br />
25<br />
20<br />
15<br />
10<br />
5<br />
0<br />
x1t1spr<br />
0 10 20 30<br />
East (m)<br />
Figure 6. Conditions after particle filter initialization.<br />
Available measurements were processed every 0.5 s. Tag<br />
speed was held constant at 0.5 m/s. No dead reckoning<br />
sensors were employed, so that the geolocation estimates<br />
calculated by both filters were not propagated between<br />
measurements; however, the error covariance matrices<br />
were increased within both filters using (21). The process<br />
noise covariance matrix Q(i) = v(i)I was calculated using<br />
sequential differencing of the position estimates to estimate<br />
the variance v(i).<br />
The simulation was run for 94 s at a time step of 0.5 s.<br />
The time delay (in meters) for the direct and indirect paths<br />
are plotted in Figure 7. The two indirect paths from Node<br />
1 have a single crossover point at 20 s. The two indirect<br />
paths from Node 2 have a single crossover point at 70 s,<br />
with a near-crossover at 17 s. The data association algorithm<br />
given in the previous section was employed using<br />
quadratic regression models and produced no data association<br />
errors.<br />
The true and estimated paths over time for both filters<br />
are shown in Figure 8. True tag location is shown by the<br />
solid black line. The estimated path for the multipath filter<br />
(MP) is shown by the solid colored line, while the estimated<br />
path for the conventional filter (CV) is shown by the<br />
dotted colored line. While both direct paths are detected<br />
(for the first 55 s), the MP filter and the CV filter produce<br />
identical geolocation estimates (blue line). After the direct<br />
path from Node 2 is lost at 55.5 s, the CV filter is able to<br />
navigate off the direct path from Node 1 only, while the MP<br />
filter, in addition, is able to navigate off the indirect path<br />
from Node 1 reflected off the bottom wall and the indirect<br />
path from Node 2 reflected off the West wall. The MP<br />
filter estimate (solid red line) produces very small tracking<br />
errors, while the CV filter errors (dotted silver line) start to<br />
grow. When both direct paths become undetected at 73.5<br />
s, the CV filter can no longer track at all; its geolocation<br />
estimate remains constant for the remainder of the simulation.<br />
In comparison, the MP filter is able to navigate off the<br />
10 Innovative Indoor Geolocation Using RF Multipath Diversity<br />
m<br />
m<br />
North (m)<br />
70<br />
60<br />
50<br />
40<br />
30<br />
20<br />
Node 1<br />
10<br />
0 20 40 60 80 100<br />
60<br />
50<br />
40<br />
30<br />
20<br />
Time (s)<br />
x1dy<br />
10<br />
0 20 40 60 80 100<br />
30<br />
25<br />
20<br />
15<br />
10<br />
5<br />
0<br />
Node 2<br />
Time (s)<br />
Figure 7. Measurement delay vs. time.<br />
Node 1 Node 2<br />
x1tag<br />
0 10 20 30<br />
East (m)<br />
Figure 8. Comparison of true and estimated paths.<br />
detected indirect paths. Between 73.5 and 77.5 s, the MP<br />
filter navigates off the indirect path from Node 1 reflected<br />
off the bottom wall and both indirect paths from Node 2.<br />
At 78 s, the indirect path from Node 2 reflected from the<br />
West wall becomes undetected, and the MP filter is reduced<br />
to using both indirect path measurements off the bottom<br />
wall. At 84 s, all four indirect paths become detectable and<br />
are used by the MP filter until the end of the simulation.
m<br />
m<br />
m<br />
30<br />
20<br />
10<br />
North Position<br />
0<br />
0 20 40 60 80 100<br />
4<br />
2<br />
0<br />
-2<br />
North Error: MP<br />
Time (s)<br />
-4<br />
0 20 40 60 80<br />
4<br />
2<br />
0<br />
-2<br />
North Error: CV<br />
Time (s)<br />
-4<br />
x1npe<br />
-10<br />
x1epe<br />
0 20 40 60 80<br />
0 20 40 60 80<br />
Time (s)<br />
Figure 9. North position tracking performance<br />
comparison.<br />
Figures 9 and 10 compare the tracking performance for<br />
the two filters along North and East. Position estimate<br />
histories are shown in the top panel. Solid lines show MP<br />
estimates, while dotted lines show CV estimates; red lines<br />
begin at 55.5 s, when the direct path from Node z is lost.<br />
The middle panel displays the error histories for MP, while<br />
the bottom panel displays the error histories for the CV.<br />
True errors are indicated by solid lines and filter-derived<br />
1s error bounds are shown in dotted lines. The red lines<br />
indicate the performance after the direct path from Node 2<br />
is lost at 55.5 s. The ability of MP to recover over the last 10<br />
s, after all four indirect paths are detected, is clearly shown.<br />
In comparison, CV cannot use the indirect path measurements<br />
and its geolocation errors continue to diverge.<br />
Multipath parameter estimation performance is shown in<br />
Figure 11 for the two indirect paths associated with Node 1<br />
and in Figure 12 for the two indirect paths associated with<br />
Node 2. In this two-dimensional example, the multipath<br />
parameters are the angle y(i) = arctan(x1(i)/x2(i)) (four<br />
quadrant) and the offset parameter c(i). In the figures, the<br />
solid black lines denote the true parameter values. The<br />
blue lines denote the estimates during periods of time<br />
m<br />
m<br />
m<br />
20<br />
15<br />
10<br />
5<br />
East Position<br />
0<br />
0 20 40 60 80 100<br />
0<br />
-5<br />
-10<br />
0<br />
-5<br />
East Error: MP<br />
Time (s)<br />
0 20 40 60 80<br />
East Error: CV<br />
Time (s)<br />
Time (s)<br />
Figure 10. North position tracking performance<br />
comparison.<br />
when the multipath parameters are being estimated (direct<br />
and indirect path measurements are available simultaneously),<br />
while the red lines denote the estimates during<br />
periods when direct path measurements are unavailable.<br />
PSI (deg)<br />
Node 1, MPATH #1: PSI<br />
-50<br />
-100<br />
-150<br />
0 20 40 60 80<br />
Time (s)<br />
m<br />
Node 1, MPATH #1: Offset<br />
80<br />
60<br />
40<br />
20<br />
0<br />
0 20 40 60 80<br />
Time (s)<br />
Figure 11. Multipath parameter estimation: Node 1<br />
measurements.<br />
Deg<br />
m<br />
Node 1, MPATH #2: PSI<br />
50<br />
0<br />
-50<br />
0 20 40 60 80<br />
Time (s)<br />
Node 1, MPATH #2: Offset<br />
80<br />
60<br />
40<br />
20<br />
0<br />
0 20 40 60 80<br />
Time (s)<br />
x1par1<br />
Innovative Indoor Geolocation Using RF Multipath Diversity 11
PSI (deg)<br />
m<br />
Node 2, MPATH #1: PSI<br />
150<br />
100<br />
50<br />
0 20 40 60 80<br />
Time (s)<br />
Node 2, MPATH #1: Offset<br />
80<br />
60<br />
40<br />
20<br />
0<br />
0 20 40 60 80<br />
Time (s)<br />
Figure 12. Multipath parameter estimation: Node 2<br />
measurements.<br />
For Node 1, the parameters for the first indirect path (off<br />
the West wall) are estimated with reasonable accuracy after<br />
40 s. The parameters for the second path (off the South<br />
wall) cannot be estimated for the first 27 s since the indirect<br />
path is blocked by the rectangular object. When estimation<br />
commences at 27.5 s, the parameters are almost immediately<br />
estimated with high accuracy, and this accuracy level<br />
continues until the direct path is blocked at 73.5 s.<br />
For Node 2, the parameters for the first indirect path (off<br />
the East wall) are estimated with reasonable accuracy<br />
after 45 s. The direct path becomes blocked at 55.5 s, so<br />
that further updating of the parameter estimates was not<br />
possible. The second indirect path (off the South wall)<br />
was blocked for the first 34 s. At 34.5 s, the indirect path<br />
became unblocked and the indirect path parameters were<br />
estimated. At the next time step (35 s), the direct path<br />
became blocked and remained blocked for the remainder<br />
of the simulation, precluding further estimation of the<br />
indirect path parameters. Thus, in this case, the indirect<br />
parameter estimates are based on a single measurement<br />
pair.<br />
As discussed previously, the variation in the true multipath<br />
parameters was relatively small in this representative<br />
example, so that relatively accurate tag tracking could be<br />
maintained when it was no longer possible to perform<br />
parameter estimation.<br />
12 Innovative Indoor Geolocation Using RF Multipath Diversity<br />
deg<br />
m<br />
Node 2, MPATH #2: PSI<br />
50<br />
0<br />
-50<br />
0 20 40 60 80<br />
Time (s)<br />
Node 2, MPATH #2: Offset<br />
80<br />
60<br />
40<br />
20<br />
0<br />
0 20 40 60 80<br />
Time (s)<br />
x1par2<br />
Conclusion<br />
A new approach is suggested for the problem of indoor<br />
geolocation in the presence of dominating multipath using<br />
RF time-of-arrival measurements. Multipath delays are<br />
modeled using a geometry-based argument. Assuming a<br />
series of specular reflections off planar surfaces, the model<br />
contains a maximum of three unknown multipath parameters<br />
per path, which may be estimated in a nonlinear<br />
filter. Simulation results for a relatively simple representative<br />
example suggest that multipath parameters can be<br />
estimated with sufficient accuracy to maintain geolocation<br />
accuracy when one or more direct paths are undetected.<br />
This approach allows the possibility of building up indoor<br />
map information as the geolocation process commences.<br />
references<br />
[1] Pahlavan, K. and X. Li, “Indoor Geolocation Science and<br />
Technology,” IEEE Communications Magazine, February<br />
2002.<br />
[2] Pahlavan, K., F. Akgul, M. Heidari, and H. Hatami, “Precision<br />
Indoor Geolocation in the Absence of Direct Path,” submitted<br />
to IEEE Communications Magazine.<br />
[3] Moghaddam, P.P., H. Amindavar, R. L. Kirlin, “A New Time-<br />
Delay Estimation in Multipath,” IEEE Trans. on Signal Processing,<br />
Vol. 51, No. 5, May 2003, pp. 1129-1142.<br />
[4] Voltz, P.J. and D. Hernandez, “Maximum Likelihood Time of<br />
Arrival Estimation for Real-Time Physical Location Tracking<br />
of 802.11a/g Mobile Stations in Indoor Environments,” IEEE<br />
Paper No. 0-7803-8416-4/04, 2004.<br />
[5] Qi, Y., H. Suda, H. Kobayashi, “On Time-of-Arrival Positioning<br />
in a Multipath Environment,” IEEE Paper No. 0-7803-<br />
8521-7/04, 2004.<br />
[6] Giremus, A. and J.-Y. Tourneret, “Joint Detection/Estimation<br />
of Multipath Effects for the Global Positioning System,” Proc.<br />
IEEE ICASSP, 2005.<br />
[7] Do, J.-Y., M. Rabinowitz, P. Enge, “Linear Time-of Arrival Estimation<br />
in a Multipath Environment by Inverse Correlation<br />
Method,” Proc. ION Annual Meeting, Cambridge, MA, June<br />
2005.<br />
[8] Erickson, J.W., P.S. Maybeck, J.F. Raquet, “Multipath-Adaptive<br />
GPS/INS Receiver,” IEEE Trans. Aero. Elect. Sys., Vol.<br />
41, April 2005, pp. 645-657.<br />
[9] Jourdan, D.B., J.J. Deyst, M.Z. Win, N. Roy, “Monte Carlo<br />
Localization in Dense Multipath Environments Using UWB<br />
Ranging,” Proc. IEEE International Conference on Ultra-<br />
Wideband, Zurich, September 2005, pp. 314-319.<br />
[10] Ristic, B., S. Arulampalam, N. Gordon, Beyond the Kalman<br />
Filter, Chapter 3, Artech House, Boston, 2004.<br />
[11] Jazwinski, A.H., Stochastic Processes and Filtering Theory,<br />
Academic Press, New York, 1970.<br />
[12] Bierman, G.J., Factorization Methods for Discrete Sequential<br />
Estimation, Academic Press, New York, 1977.
(clockwise from left)<br />
Donald E. Gustafson,<br />
John M. Elwell and<br />
J. Arnold Soltz<br />
bios<br />
Donald E. Gustafson is a Distinguished<br />
Member of the Technical<br />
Staff at <strong>Draper</strong> with over 40<br />
years experience in the conceptual<br />
design and analysis of guidance,<br />
navigation, and control<br />
(GN&C) systems. He is one of<br />
the principal developers of <strong>Draper</strong>’s<br />
Deep Integration system for<br />
GPS-based navigation. Currently,<br />
he is working on concepts to exploit RF multipath signals in noisy multipath-rich urban and indoor environments for geolocation<br />
and mapping. Previously, at MIT Lincoln <strong>Laboratory</strong>, he worked on target surveillance using antenna arrays. Prior to this, he<br />
was co-founder and Vice President of Scientific Systems, Cambridge, MA, where he worked on aircraft failure detection, adaptive<br />
control of plastic injection molding machines, biomedical signal processing, meteorological satellite data processing, and<br />
financial forecasting. At the MIT Instrumentation <strong>Laboratory</strong>, he worked on Apollo navigation system design and computerized<br />
electrocardiogram interpretation. He was the co-recipient of two <strong>Draper</strong> Best Technical Publication Awards, two <strong>Draper</strong> Patent of<br />
the Year Awards, and was co-recipient of the 2000 <strong>Draper</strong> Distinguished Performance Award for the development and demonstration<br />
of <strong>Draper</strong>’s GPS/Inertial Navigation System (INS) Deep Integration technique and hardware. He has authored more than<br />
35 technical papers. He holds a PhD in Instrumentation and Automatic Control from the Massachusetts Institute of Technology<br />
(MIT) (1973).<br />
John M. Elwell is a <strong>Laboratory</strong> Technical Staff Member and is currently Tactical System Program Development Manager with 40<br />
years experience developing systems for guidance, precision pointing and tracking, and fire control. Recent activity has been in<br />
the area of long-range guided projectiles for electromagnetic railguns and in the exploitation of RF phenomena in urban environments.<br />
He is a co-developer of Deep Integration antijam technology for GPS receivers. He has been a member of the Defense<br />
Science Board Task Forces on Precision Targeting, Missile Defense, and Modeling and Simulation, and has been presented the<br />
SDIO/AIAA Award for contributions to guidance technology. He has authored numerous papers relating to GN&C and has<br />
several patents associated with precision pointing and navigation. He holds a BSEE from Northeastern University, an MEE from<br />
Rensselaer Polytechnic Institute, and an MBA from Canisius College.<br />
J. Arnold Soltz is a Principal Member of the Technical Staff at <strong>Draper</strong> with over 40 years experience in the design, implementation,<br />
and verification of the models of signals, sensors, and systems used for navigation in spacecraft, aircraft, terrestrial surveying, and<br />
undersea vehicles. Fielded systems have included the integration of inertial navigation technology with GPS, laser tracking, RF<br />
tracking, and sonar. Recent contributions have included design and development of generalized linear covariance analysis software,<br />
verification of a model of the indoor RF environment, and the design and verification of a 5-state Kalman filter for removing<br />
the effects of the ionosphere on GPS signals. He has two <strong>Draper</strong> patents and was the co-recipient of two <strong>Draper</strong> Best Technical<br />
Publication Awards. He has a BA from Johns Hopkins University (1964) and an MS from Northeastern University (1969), and is<br />
a member of the Institute of Navigation (ION).<br />
Innovative Indoor Geolocation Using RF Multipath Diversity 13
14<br />
Engineering MEMS Resonators<br />
with Low Thermoelastic Damping<br />
Amy E. Duwel, 1 Rob N. Candler, 2 Thomas W. Kenny, 2 Mathew Varghese 1<br />
Copyright © 2006, IEEE. Published in IEEE JMEMS, Vol. 15, No. 6, 2006<br />
Nomenclature<br />
Variable Physical Definition<br />
E Young’s modulus<br />
a Coefficient of thermal expansion<br />
To Nominal average temperature (300 K)<br />
r Density of solid<br />
Csp Specific heat capacity of a solid<br />
Cv Heat capacity of a solid, Cv = rCsp k Thermal conductivity of a solid<br />
wmech Mechanical resonance frequency<br />
tn Characteristic time constant for thermal mode n<br />
s Stress<br />
e Strain<br />
l, µ Elastic Lamé parameters<br />
T Temperature<br />
S Entropy<br />
[u v w] Components of displacement in x,y, and z directions, respectively<br />
= [u, v] 2D vector of mechanical displacements<br />
Mechanical mode amplitude<br />
U m<br />
abstract<br />
This paper presents two approaches to analyzing and calculating<br />
thermoelastic damping in micromechanical resonators. The<br />
first approach solves the fully coupled thermomechanical equations<br />
that capture the physics of thermoelastic damping in both<br />
two and three dimensions (2D and 3D) for arbitrary structures.<br />
The second approach uses the eigenvalues and eigenvectors of<br />
the uncoupled thermal and mechanical dynamics equations to<br />
calculate damping. We demonstrate the use of the latter approach<br />
to identify the thermal modes that contribute most to damping,<br />
and present an example that illustrates how this information<br />
may be used to design devices with higher quality factors. Both<br />
approaches are numerically implemented using a finite-element<br />
solver (Comsol Multiphysics). We calculate damping in typical<br />
micromechanical resonator structures using Comsol Multiphysics<br />
and compare the results with experimental data reported in<br />
literature for these devices.<br />
m Mechanical eigenmode shape function<br />
wm Mechanical resonant frequency for eigenmode m<br />
An Thermal mode amplitude<br />
Tn Thermal eigenmode shape function<br />
wth Characteristic frequency of dominant thermal mode<br />
DW Energy lost from mechanical resonator system<br />
W Energy stored in mechanical resonator<br />
1 <strong>Draper</strong> <strong>Laboratory</strong>, Cambridge, MA<br />
2 Stanford University, Departments of Mechanical and Electrical Engineering, Stanford, CA
Introduction<br />
Micromechanical resonators are used in a wide variety<br />
of applications, including inertial sensing, chemical and<br />
biological sensing, acoustic sensing, and microwave transceivers.<br />
Despite the distinct design requirements for each<br />
of these applications, a ubiquitous resonator performance<br />
parameter emerges. This is the resonator’s Quality factor<br />
(Q), which describes the mechanical energy damping. In<br />
all applications, it is important to have design control over<br />
this parameter, and in most cases, it is invaluable to minimize<br />
the damping. Over the past decade, both experimental<br />
and theoretical studies [1]-[6],[9],[22] have highlighted the<br />
important role of thermoelastic damping (TED) in micromechanical<br />
resonators. However, the tools available to<br />
analyze and design around TED in typical micromechanical<br />
resonators are limited to analytical calculations that<br />
can be applied to relatively simple mechanical structures.<br />
These are based on the defining work done by Zener in<br />
References [7] and [8].<br />
Zener developed general expressions for thermoelastic<br />
damping in vibrating structures, with the specific case<br />
study of a beam in its fundamental flexural mode. In Reference<br />
[8], Zener’s calculation was based on fundamental<br />
thermodynamic expressions for stored mechanical energy,<br />
work, and thermal energy that used coupled thermalmechanical<br />
constitutive relations for stress, strain, entropy,<br />
and temperature. However, in order to evaluate these<br />
energy expressions for a specific resonator, Zener proposed<br />
that the strain and temperature solutions from uncoupled<br />
dynamical equations could be sufficient. He found the<br />
eigensolutions of the mechanical equation, and, separately,<br />
the eigensolutions of the uncoupled thermal equation.<br />
By applying these to the coupled thermodynamic energies,<br />
Zener calculated the thermoelastic Q of an isotropic<br />
homogenous resonator to be:<br />
where the physical constants are listed in the Nomenclature,<br />
w mech is the mechanical resonance frequency, and t n is the<br />
characteristic time constant of a given thermal mode. This<br />
takes into account the fact that multiple thermal modes<br />
may add to the damping of a single mechanical resonance.<br />
The contribution of a given mode, n, is determined by its<br />
weighting function, f n .<br />
Zener explicitly calculated the weighting functions for a<br />
simple beam resonating in its fundamental flexural mode.<br />
In order to make the analysis tractable, he assumed that<br />
only thermal gradients across the beam width (dimension<br />
in the direction of the flexing) were significant. This left<br />
only a 1D thermal equation to solve. Zener found that a<br />
single thermal mode dominated, giving<br />
(1)<br />
(2)<br />
Few structures are amenable to the simplifications that led<br />
to expression (2) for Q. However, Zener’s expression (1) is<br />
quite general. In the section “Weakly Coupled Approach to<br />
TED Solutions,” we show how numerical solutions to the<br />
uncoupled mechanical and thermal dynamics of a resonator<br />
can be used to evaluate (1). This adds a great deal of<br />
power to Zener’s approach, since arbitrary geometries can<br />
be considered.<br />
We show how Zener’s weighting function approach offers<br />
an intuition into the details of the energy transfer. At the<br />
same time, our results highlight the limits of intuition in<br />
identifying the thermal modes of interest. For example, we<br />
find that the simplification Zener made in assuming only<br />
thermal gradients in one direction along the beam were<br />
significant does not capture the most important thermal<br />
mode, even for a simple beam. In addition, past efforts<br />
to estimate Q without explicitly calculating the weighting<br />
functions have been shown [9] to greatly overestimate the<br />
damping behavior of real systems. This “modified” interpretation<br />
of Zener’s method can be misleading.<br />
In this paper, we describe a method for using full numerical<br />
solutions to evaluate Q using Zener’s approach. We call<br />
this a “weakly coupled” approach. We also present our<br />
numerical method for solving the fully coupled thermoelastic<br />
dynamics equations to calculate Q for an arbitrary<br />
structure. Using numerical solutions in the weakly coupled<br />
approach offers powerful guidance in engineering around<br />
thermoelastic damping, while fully coupled solutions offer<br />
the ability to precisely evaluate and optimize the thermoelastic<br />
Q of a resonator.<br />
Numerical solution of the Fully Coupled teD<br />
equations<br />
The coupled equations governing thermoelastic vibrations<br />
in a solid are derived in Reference [19]. The following<br />
section, “Governing Equations in 3D,” outlines the basic<br />
principles of this derivation. “Governing Equations in 2D<br />
with Plane Stress Approximations” highlights modifications<br />
required for a 2D plane stress formulation. The full<br />
2D and 3D equations are written explicitly so that they are<br />
accessible to the user community. We numerically solve the<br />
2D and 3D dynamical equations using the finite-elements<br />
based package Comsol Multiphysics. [11] The Comsol implementation<br />
is described in References [12] and [13]. This<br />
analysis can be applied to the wide variety of microelectromechanical<br />
system (MEMS) resonator structures reported<br />
in the literature. It is a useful tool for determining whether<br />
TED limits performance or whether other damping mechanisms,<br />
such as anchor damping, [23] should be investigated<br />
instead. “Quality Factor Calculations for Typical MEMS<br />
Resonators” demonstrates the application of TED simulations<br />
to a few example MEMS resonator structures. Quality<br />
factors are calculated and compared with the analytical Eq.<br />
(1) as well as with experimental measurements reported in<br />
the literature.<br />
Engineering MEMS Resonators with Low Thermoelastic Damping 15
Governing Equations in 3D<br />
The constitutive relations for an isotropic thermoelastic<br />
solid, derived from thermodynamic energy functions, are<br />
in matrix form<br />
and<br />
where reduced tensor notation has been used, and the variables<br />
are defined in the Nomenclature.<br />
To obtain the coupled dynamics, the constitutive relations<br />
are applied to the force balance constraints and Fourier’s<br />
law of heat transfer. Force balance in the x direction gives<br />
with similar relations for the y and z directions.<br />
Substituting displacement for strain and simplifying, the<br />
3D equations of motion become<br />
To obtain the thermal dynamics, we apply Fourier’s law<br />
The constitutive relations are applied, and the resulting<br />
equation is linearized around T o , the ambient temperature,<br />
to give, in 3D<br />
16 Engineering MEMS Resonators with Low Thermoelastic Damping<br />
(3)<br />
(4)<br />
(5)<br />
(6)<br />
(7)<br />
(8)<br />
(9)<br />
(10)<br />
In summary, Eqs. (6)-(8) and (10) form a set of coupled<br />
linear equations in 3D. Since the equations are linear, we<br />
can use a finite-elements-based approach to solving them<br />
on an arbitrary geometry. We solve for the unforced eigenmodes.<br />
The generalized eigenvectors contain u, v, w, and<br />
T at every node. The eigenvalues, w i , are complex. The<br />
imaginary component represents the mechanical vibration<br />
frequency, while the real part provides the rate of decay for<br />
an unforced vibration due to the thermal coupling. The<br />
quality factor of the resonator is defined as<br />
(11)<br />
Governing Equations in 2D with Plane Stress<br />
Approximations<br />
For long beams in flexural vibrations, we can identify one<br />
axis (we chose to be z) in which all strains are uniform<br />
and no loads are applied. For clarity, we define the x axis<br />
along the beam length and the y axis in the direction of<br />
flexing. Along the z direction s 3 , s 4 , and s 5 must be zero<br />
throughout the structure. This is essentially a plane stress<br />
approximation. When s 3 = 0 is applied to Eq. (3) above,<br />
we find that<br />
(12)<br />
In the plane stress approximation, the force balance relation<br />
(5) is<br />
(13)<br />
Expanding the stress terms using the constitutive relations<br />
Applying (12) to (14), the equations of motion become<br />
The linearized temperature equation is<br />
(14)<br />
(15)<br />
(16)<br />
(17)<br />
We apply Eq. (12) and also neglect z-directed temperature<br />
gradients to obtain
(18)<br />
In summary, Eqs. (15)-(16) and (18) form a set of coupled<br />
linear equations in 2D. In order to find Q, we solve for<br />
the unforced eigenmodes. The generalized eigenvectors<br />
contain u, v, and T at every node.<br />
Quality Factor Calculations for Typical MEMS<br />
Resonators<br />
The thermoelastic Q values for several example MEMS resonators<br />
have been calculated. Table 1 introduces the resonator<br />
structures and the material parameters used. In Table<br />
2, we summarize the simulated Q values for the various<br />
structures. We compare simulated results to calculations<br />
based on Eq. (2) where applicable. We also compare to data<br />
reported in the literature. In some cases, the experimental<br />
data appear to have achieved the thermoelastic limit. For<br />
these devices, it is clear that structural modifications that<br />
Resonator Units Flexural<br />
(2D)<br />
can engineer a higher thermoelastic limit are warranted. In<br />
devices where the measured Q value is less than half the<br />
thermoelastic limit, investigation into and minimization of<br />
other damping mechanisms is warranted.<br />
A polysilicon beam resonating in its fundamental flexural<br />
mode was simulated and compared to measurements. [9] In<br />
the experiments, the beam was actually part of a doubly<br />
clamped tuning fork to minimize anchor damping. For a<br />
resonator operating at 0.57 MHz, the measured Q equaled<br />
10,281. Zener’s formula, Eq. (2), predicts Q = 10,300, for<br />
the beam at 0.57 MHz and with t = a 2 /p 2 D th (a = 12-µm<br />
beamwidth in the direction of flexural motion, and D th =<br />
k/rC sp ). The simulations used only a single clamped beam<br />
with dimensions matching the beam of the tuning fork.<br />
The simulated frequency was 0.63 MHz and the simulated<br />
TED Q = 10,211. This remarkable correlation between<br />
simulation results and experiments suggests that the flexural<br />
beam Q is limited by thermoelastic damping. Higher<br />
thermoelastic Q might be achieved by geometry modifications<br />
as explored in Reference [9] or by fabricating a given<br />
structure from different materials as explored in Reference<br />
[6].<br />
Table 1. Summary of Parameters Used in Q Simulation and Calculations for a Longitudinal Resonator.<br />
Longitudinal<br />
(2D)<br />
Longitudinal<br />
(3D)<br />
Torsional<br />
(3D)<br />
Flexural with<br />
Slit (3D)<br />
Material Polysilicon Silicon Si 0.35 Ge 0.65 Silicon Polysilicon<br />
Material Property References Ref. [9] Refs. [14], [24] Ref. [9]<br />
Critical Dimensions µm 400 x 12 x 20 290 x 10 x 10 32 x 40 x 2.2 5.5 x 2 x 0.2 150 x 3.5 x 35<br />
Young’s Modulus GPa 157 180 155 180 157<br />
Density kg/m 3 2330 2330 4810 2330 2330<br />
Specific Heat J/kg • K 700 700 377 700 700<br />
Thermal Conductivity W/m • K 90 130 59 130 90<br />
Thermal Expansion Coeff. ppm/K 2.6 2.6 4.3 2.6 2.6<br />
Table 2. Summary of Simulated Q Values for a Selection of MEMS Resonators. Simulation Results Are Compared with<br />
Calculations Based on Zener’s Single-Mode Approximation and Measured Results Reported in the Literature.<br />
Fixed-fixed<br />
beam 2D<br />
Longitudinal<br />
2D<br />
Longitudinal<br />
3D<br />
Torsional<br />
3D<br />
Fixed-fixed<br />
beam 2D<br />
Resonator Simulated<br />
Frequency<br />
Measured<br />
Frequency<br />
Simulated<br />
Q<br />
Analytical<br />
Q<br />
Measured<br />
Q<br />
Experimental<br />
Reference<br />
0.63 MHz 0.57 MHz 10,300 10,300 10,281 Reference [9]<br />
15.3 MHz 14.7 MHz 1,650,000 N/A 170,000 Reference [20]<br />
70.5 MHz 74.4 MHz 366,000 N/A 2863 Reference [15]<br />
4.4 MHz 5.6 MHz 2E8 N/A 3300 Reference [16]<br />
1.27 MHz 1.15 MHz 26,000 N/A 5600 Reference [21]<br />
Engineering MEMS Resonators with Low Thermoelastic Damping 17
A Si 0.35 Ge 0.65 capacitively-actuated, longitudinal mode<br />
resonator was modeled and simulated based on geometry<br />
information provided in Reference [15] and material<br />
properties reported in References [14], [24]. 4 µm ×<br />
4 µm anchors were included in the simulation, with fixed<br />
boundary conditions at the ends of the anchors. Quévy et<br />
al. report the Q measurement of 2863 for the fundamental<br />
longitudinal mode of a bar resonator. Equation (2) was not<br />
applied to calculate the analytical Q, since the derivation<br />
was for flexural modes only. We find that the TED Q is<br />
two orders higher than the measured Q. This suggests that<br />
thermoelastic damping, for the fundamental longitudinal<br />
mode, is not a significant contributor to the overall energy<br />
loss in this resonator. Other mechanisms, such as anchor<br />
damping, are being optimized by this group with tangible<br />
impact on Q being reported. [25]<br />
A second longitudinal resonator was also simulated. The<br />
device described in Reference [20] is single-crystal silicon,<br />
and its resonance length of 290 µm far exceeds its other<br />
dimensions. This resonator is also capacitively actuated<br />
and operates at 14.7 MHz. The measured Q is 170,000,<br />
while the simulated thermoelastic Q is an order of magnitude<br />
larger. This device also does not appear to be thermoelastically<br />
limited.<br />
A paddle resonator operating in its torsional resonance<br />
was simulated. The simulation model was based on the<br />
nonmetalized silicon-on-insulator (SOI) device described<br />
in Reference [16]. Fixed-fixed boundary conditions were<br />
applied to the ends of the tethers. The simulated resonant<br />
frequency was about 20% lower than the measured torsional<br />
frequency. The value of Young’s modulus used in the simulations<br />
was on the high end of values reported in Reference<br />
[17], so is unlikely to explain the discrepancy. Analytical<br />
calculation of the torsional frequency using Reference [18]<br />
given a total torsional stiffness of 9.4 × 10⁻¹² N • m/rad for<br />
the beams, and a second moment of inertia of 1.3 × 10⁻²⁶ kg • m2 for the plate yields 4.3 MHz, within 3% of the<br />
simulated result. The discrepancy between the measured<br />
frequency and the theoretical frequencies may be the result<br />
of fabrication-induced variations in the sample dimensions.<br />
Evoy et al. reported experimental Q values in the range<br />
of 3300 for room temperature measurements, while the<br />
simulations predict thermoelastic Q values of 200 million.<br />
The simulated result is consistent with the physical understanding<br />
that torsional deformations produce little or no<br />
volumetric expansion and should therefore have negligible<br />
thermoelastic damping.<br />
Finally, the flexural mode polysilicon beam with a center<br />
opening described in Reference [21] was simulated. The<br />
case with a beam length of 150 µm and width of 3.5 µm<br />
was considered. Since the material parameters of the device<br />
were not available, we used the polysilicon values of Reference<br />
[9]. Although the center opening dimensions were<br />
not provided, the scanning electron microscope (SEM)<br />
indicated that the slit was extremely narrow. Using Comsol<br />
18 Engineering MEMS Resonators with Low Thermoelastic Damping<br />
Multiphysics, the narrowest slit we were able to model was<br />
0.1 µm wide, centered in the 3.5-µm beamwidth. The slit<br />
was also centered in the 35-µm beam height, spaced 2 µm<br />
from top and bottom. The measured Q was 5600, while<br />
the simulated TED-limited Q was 26,000. This simulated<br />
Q dropped to 25,000 for a solid polysilicon beam at the<br />
same frequency. We also simulated a wider slit and found<br />
that the Q went up to 26,200 for a slit 0.35 µm wide. This<br />
suggests that at this frequency, the polysilicon beam has a<br />
TED-limited Q that starts at 25,000 and can be increased<br />
with an increasingly wider slit. The experimental reference<br />
may have had a narrower slit than we were able to<br />
model, but the simulations were useful in bounding the<br />
TED-limited Q between approximately 25,000-26,000<br />
and in identifying the trend. The TED Q is about 4.5 times<br />
higher than the experimentally measured Q. Though the<br />
device does not appear to be TED limited, thermoelastic<br />
damping is clearly important in this device and can still<br />
be optimized.<br />
Weakly Coupled approach to teD solutions<br />
Thermoelastic damping in MEMS resonators can also be<br />
calculated via a weakly coupled approach proposed by<br />
Zener. This approach uses eigenvalue solutions to the<br />
uncoupled mechanical and thermal equations. [8] We show<br />
how to numerically implement Zener’s approach so that<br />
structures more complicated than a solid beam can be studied.<br />
While the fully coupled numerical analysis presented<br />
in the previous section is much more accurate, we emphasize<br />
that Zener’s approach can offer design insights that<br />
might not otherwise be possible. The next four sections<br />
describe the analysis. For simplicity, the formulas in this<br />
section are written for the 2D case and use vector notations,<br />
with<br />
where u and v are the displacements in the x and y directions,<br />
respectively.<br />
In the next section, “Modal Solutions to Thermal and<br />
Mechanical Systems,” we introduce time-harmonic modal<br />
expansions for the mechanical and thermal domain solutions.<br />
Both the thermal modes and the mechanical modes<br />
of a given structure can be found numerically by eigenvalue<br />
analysis, assuming no thermoelastic coupling. This<br />
section also shows how to calculate the relative thermal<br />
mode amplitudes that are driven by the one mechanical<br />
mode. The two sections that follow introduce two expressions<br />
for the energy loss per cycle. In “Energy Lost from<br />
Mechanical Domain,” the mechanical energy loss as a<br />
function of mechanical and thermal modes is derived.<br />
By energy conservation, this is equal to the energy transferred<br />
to the thermal domain. In “Energy Transferred to<br />
Thermal Domain,” the energy coupled into the thermal<br />
domain is taken directly from Reference [8], where the net<br />
heat rise is derived in terms of the entropy generated per<br />
cycle. The expressions for energy lost per cycle in these
two sections can be evaluated directly from the modal solutions<br />
obtained numerically. Although it is not obvious on<br />
inspection that the two expressions are algebraically identical,<br />
energy conservation requires that they are equal. We<br />
have validated this numerically for isotropic solids, and<br />
Reference [8] provides an algebraic proof for solids with<br />
cubic symmetry.<br />
In “Using Weighting Functions to Optimize a UHF Beam<br />
Resonator,” we apply the weakly coupled formulation to<br />
the cases of a solid beam and two versions of a slotted<br />
beam. We describe insights gained by studying the modes<br />
obtained in the weakly coupled approach. In each example,<br />
we compare the Q value found with the Q calculated<br />
through a fully coupled analysis. A thorough experimental<br />
study of the slotted beam is referenced, [9] where TED<br />
calculations are compared with experimental measurements<br />
over a wide range of frequencies.<br />
Modal Solutions to Thermal and Mechanical Systems<br />
Zener first identified the mechanical resonant mode of<br />
interest and assumed a sinusoidal steady state of the form<br />
(19)<br />
This is the m th eigensolution to the vector version of Eqs.<br />
(15)-(16), without the thermal coupling term. (x,y) is a<br />
real valued modal shape function, U m is the mode amplitude,<br />
and w m is the mechanical resonant frequency. Note<br />
that the shape functions and frequencies can be found<br />
numerically using either Comsol Multiphysics or another<br />
commercially-available software package.<br />
Spatial variations of strain caused by the mechanical vibration<br />
generate thermal gradients that are captured by the<br />
driven thermal equation<br />
(20)<br />
where q c captures the combination of constants written<br />
explicitly in Eq. (17), and where the term of order a 2 is<br />
neglected. For simplicity, we also limit our study to one<br />
mechanical mode at a time, mech and w mech<br />
(21)<br />
This equation is solved as a function of the mechanical<br />
resonance amplitude, U mech . Applying separation of variables,<br />
the response to a drive at frequency w mech is<br />
(22)<br />
The functions T n(x, y) are the real-valued spatial eigenmodes<br />
of the undriven thermal equation and A n are the<br />
complex modal amplitudes. To find the modal amplitudes,<br />
we apply the orthogonality of the eigenmodes T n (x, y). The<br />
expansion (22) is substituted into (21). Multiplying equation<br />
(21) by T l and integrating over the volume, we obtain<br />
with<br />
(23)<br />
(24)<br />
(25)<br />
The absolute magnitude of |An/Umech| from Eq. (23) can be<br />
used to assess the effective coupling of mechanical modes<br />
into the thermal domain.<br />
To calculate the mechanical quality factor, we first have<br />
to calculate the energy lost by the mechanical system per<br />
radian, or equivalently, the energy gained by the thermal<br />
system per radian.<br />
Energy Lost from Mechanical Domain<br />
The energy lost from the mechanical domain per radian is<br />
(26)<br />
in 2D, where s 3 = s 4 = s 5 = 0. Stress in the above equation<br />
is expanded as a function of strain and temperature<br />
using Eq. (3). The strain is expressed in terms of the modal<br />
amplitude and shape function. This expansion is further<br />
simplified by recognizing that only the temperature-dependent<br />
terms produce nonzero integrals over one cycle. Integration<br />
over time yields<br />
(27)<br />
where each term in this sum, DWn , corresponds to the<br />
energy dissipated by the nth thermal mode. The thermal<br />
component of stress that is out of phase with the strain<br />
damps the vibration, and this term may be identified in the<br />
first bracket in Eq. (27). The second bracket is the strain.<br />
Energy Transferred to Thermal Domain<br />
The expression for energy gained by the thermal domain<br />
per cycle is derived in Reference [8] to be<br />
(28)<br />
The T -1 term is replaced by its Taylor expansion, 1/T 0 −<br />
T/T o , where it is assumed that the driven modal amplitudes<br />
are small relative to the ambient temperature. Only the<br />
latter term in this expansion produces a nonzero integral<br />
over one cycle, so that<br />
(29)<br />
Engineering MEMS Resonators with Low Thermoelastic Damping 19
Where k is the thermal conductivity in Joules/(Kelvinsecond-meter).<br />
Expanding T using (22) and (23), it may<br />
be shown that Eq. (29) reduces to<br />
20 Engineering MEMS Resonators with Low Thermoelastic Damping<br />
(30)<br />
Weakly Coupled Quality Factor Calculation<br />
The maximum stored energy in the 2D mechanical system<br />
is given by<br />
(31)<br />
where the integral is evaluated at the maximum mechanical<br />
amplitude. This integral may be evaluated directly for<br />
a given mode shape by substituting Eq. (3) for stress with<br />
the appropriate 2D approximations (s 3 = s 4 = s 5 = 0). The<br />
Q of the device is then calculated by<br />
(32)<br />
where Qn is an effective Q corresponding to the nth thermal<br />
mode. In applying Eq. (32) to calculate Q, DW can be<br />
found from either Eq. (27), the expression for mechanical<br />
energy lost, or Eq. (30), the thermal energy gained. These<br />
expressions can be shown to be equivalent.<br />
This analysis shows that we can use numerically calculated<br />
modal solutions of uncoupled thermal and mechanical<br />
equations to calculate the Q. For simplicity, we restricted<br />
our analysis to a single mechanical mode of interest. We<br />
considered that possibly many thermal modes would<br />
contribute to damping in the system. The individual terms<br />
in the sum Eq. (32) for Q can be used to identify the thermal<br />
modes that contribute most to damping and evaluate<br />
their relative weights.<br />
Using Weighting Functions to Optimize a UHF Beam<br />
Resonator<br />
Figure 1 shows the calculated Q values for a range of thermal<br />
modes in a beam. The beam is assumed to be in its<br />
fundamental flexural resonance at frequency 0.63 MHz.<br />
The frequency and mode shape were found numerically.<br />
The first 40 thermal modes were also found numerically.<br />
Using the approach described in the previous four sections,<br />
we evaluated the thermoelastic damping associated with<br />
each mode. The Comsol Multiphysics module was used<br />
to evaluate the overlap integrals in |An | (Eq. (23)) that are<br />
needed to evaluate DW in Eq. (27) or (30). The total Q,<br />
based on 40 modes in Eq. (32), was found to be 10,400.<br />
The Q calculated in a full TED simulation as described in<br />
“Governing Equations in 2D with Plane Stress Approximations”<br />
was 10,200. The weakly coupled calculations show<br />
that this damping is dominated by the contribution of a<br />
single mode, whose thermal eigenfunction is shown in the<br />
inset. This mode at 0.605 MHz gave Q = 11,000. Interestingly,<br />
the temperature distribution of this mode is not<br />
uniform along the beam axis. Although Zener’s original<br />
approximation assumed that dominant thermal mode had<br />
no variation along the beam axis, we find that the uniform<br />
mode, also shown in Figure 1, has a high Q = 6,250,000.<br />
Q -1 (x10 4)<br />
1<br />
0.8<br />
0.6<br />
0.4<br />
0.2<br />
0.605-MHz Thermal Mode:<br />
Q = 11,000<br />
0.60-MHz Thermal Mode:<br />
Q = 6,250,000<br />
f mech = 0.63 MHz<br />
Q tot = 10,400<br />
0<br />
0 0.1 0.2 0.3 0.4 0.5 0.6 0.7 0.8 0.9 1<br />
Figure 1. Q values for thermal modes in a fixed-fixed,<br />
thermally-insulated beam that is 400 µm long<br />
and 12 µm wide. The mechanical resonance is<br />
the fundamental flexural mode at 0.63 MHz.<br />
The first 40 thermal modes are calculated.<br />
The three most heavily damped modes are:<br />
at 0.6 MHz with a Q of 6,250,000, at 0.605<br />
MHz with a Q of 11,000, and at 0.611 MHz<br />
with a Q of 280,000 (spatial profile not shown<br />
in inset). The total device Q, including all 40<br />
thermal modes is 10,400.<br />
After observing the thermal distribution of the dominant<br />
thermal mode, we consider the effect of placing slots in<br />
the beam. The slots, proposed originally in Reference [9],<br />
are designed to alter the dominant thermal mode without<br />
significant effect on the fundamental flexural mode<br />
frequency. Figure 2 shows the Qn values for the solid beam<br />
from Figure 1 next to the results for a slotted beam. The<br />
slots had the effect of modifying the thermal eigensolutions<br />
and characteristic frequencies. In the slotted beam, many<br />
more thermal modes contribute to the damping of the<br />
structure. On the other hand, the thermal modes with the<br />
greatest spatial overlap are moved to much higher frequencies,<br />
minimizing their overall effect on damping. In this<br />
beam, the slots had the effect of raising the total Q value by<br />
a significant factor of four.<br />
If the mechanical mode frequency were already much<br />
higher than the dominant thermal mode, then moving the<br />
dominant modes up in frequency could have a detrimental<br />
effect on Q. This case is shown in Figure 3. Originally, in<br />
the solid beam, the mechanical frequency is at 4.327 MHz,<br />
while the dominant thermal mode is still at 0.605 MHz.<br />
When slots are added to this beam, thermal modes with<br />
significant spatial overlap move up in frequency, much<br />
nearer to the mechanical resonance. This lowers the Q to<br />
20,200 from 38,000 without slots.
Q -1 (x10 4)<br />
Q -1 (x10 6)<br />
1<br />
0.8<br />
0.6<br />
0.4<br />
0.2<br />
3<br />
2<br />
1<br />
0<br />
0 1 2 3 4 5 6<br />
Frequency (MHz)<br />
Figure 2. Q values for thermal modes in a fixed-fixed,<br />
thermally-insulated beam that is 400 µm long<br />
and 12 µm wide. The top plot shows the solid<br />
beam thermal modes and mechanical resonance,<br />
while the bottom plot shows the same beam<br />
with 1-µm wide slits along the beam length.<br />
The effect of the slits on the thermal modes and<br />
their Q values indicated. The mechanical resonance<br />
shifts slightly, as expected. The total Q<br />
value is higher in the beam with slits.<br />
Q -1 (x10 5)<br />
Q -1 (x10 5)<br />
2.5<br />
2<br />
1.5<br />
1<br />
0.5<br />
f mech = 0.63 MHz<br />
Q tot = 10,400<br />
f mech = 0.5 MHz<br />
Q tot = 40,000<br />
f mech = 4,327 MHz<br />
Q tot = 38,000<br />
400-µm Beam<br />
Solid Silicon<br />
400-µm Beam<br />
Silicon, Slotted<br />
150-µm Beam<br />
Solid Silicon<br />
1.6<br />
1.4<br />
1.2<br />
1<br />
0.8<br />
0.6<br />
0.4<br />
0.2<br />
fmech = 3.75 MHz<br />
Qtot = 20,200<br />
150-µm Beam<br />
Silicon, Slotted<br />
0<br />
0 2 4 6 8 10 12 14 16<br />
Frequency (MHz)<br />
Figure 3. Q values for thermal modes in a fixed-fixed,<br />
thermally-insulated beam that is 150 µm long<br />
and 12 µm wide. The top plot shows the solid<br />
beam thermal modes and mechanical resonance,<br />
while the bottom plot shows the same beam<br />
with 1-µm wide slits along the beam length.<br />
The effect of the slits on the thermal modes and<br />
their Q values indicated. The mechanical resonance<br />
shifts slightly, as expected. The total Q<br />
value is lower in the beam with slits.<br />
Since it is not always possible to predict the most relevant<br />
thermal mode and its time constant intuitively, the<br />
numerical approach can be extremely helpful. We see that<br />
simple modifications to the resonator can have the effect<br />
of completely altering the thermal mode structure and<br />
introducing complicated weightings in the Q calculation.<br />
Both the frequency and the spatial overlap of the thermal<br />
modes are clearly important. When modes that have high<br />
spatial overlap are also close to the mechanical resonance<br />
frequency, large thermoelastic damping results. Since structural<br />
modifications that have a beneficial impact in some<br />
frequency regimes can be detrimental in others, engineering<br />
to optimize Q can be greatly enabled through the use<br />
of the numerical approach described here.<br />
Conclusion<br />
This paper presented two new tools to evaluate and optimize<br />
MEMS structures for low thermoelastic damping.<br />
The weakly coupled approach is based on original work<br />
by Zener. We reviewed Zener’s approach and showed how<br />
numerical finite-elements-based approaches can be used<br />
to fully leverage Zener’s theory. In the weakly coupled<br />
approach, the fundamental thermodynamic energy expressions<br />
are coupled. However, the strain and temperature<br />
solutions used to evaluate these energies are taken from<br />
solutions to uncoupled, standard mechanical and thermal<br />
equations. This allows us to use readily available finiteelement<br />
packages and evaluate thermoelastic damping.<br />
The approach enables a great deal of insight into the energy<br />
loss mechanism. We find that a spatial overlap of thermal<br />
modes with the strain profile in the mechanical mode of<br />
interest is a dominant term in the damping. In addition,<br />
the frequency separation between relevant thermal modes<br />
and the mechanical resonance frequency must be considered.<br />
By studying the damping contributions of individual<br />
thermal modes, their mode shapes, and their frequencies,<br />
it is possible to engineer MEMS resonators for higher Q. In<br />
addition, by reviewing the fundamental coupled thermodynamic<br />
energy expressions, we achieve a greater insight<br />
into the energy loss mechanism itself.<br />
Finally, this paper outlines a method for solving the fully<br />
coupled thermoelastic dynamics to obtain exact expressions<br />
for Q in an arbitrary resonator. The fully coupled<br />
simulations enable a precise evaluation of Q. We derive<br />
both 3D equations, as well as 2D plane stress thermoelastic<br />
equations. The simulations were conducted in Comsol<br />
Multiphysics. This software can parameterize the material<br />
parameters and geometry, so that detailed optimization<br />
studies are enabled. We showed that the fully coupled<br />
simulations predict thermoelastically limited Q in structures<br />
reported in the literature.<br />
acknowledgments<br />
The authors would like to thank Mark Mescher and Ed<br />
Carlen at <strong>Draper</strong> <strong>Laboratory</strong>, as well as Saurabh Chandorkar<br />
and Professor Ken Goodson at Stanford University<br />
for valuable conversations. We also thank Neil Barbour<br />
and John McElroy for support at <strong>Draper</strong>. This work was<br />
supported by DARPA HERMIT (ONR N66001-03-1-8942).<br />
The authors thank Dr. Clark Nguyen for his support of this<br />
portion of the project.<br />
Engineering MEMS Resonators with Low Thermoelastic Damping 21
eferences<br />
[1] Lifshitz, R. and M. Roukes, Phys. Rev. B, Vol. 61, No. 8,<br />
2000, p. 61.<br />
[2] Houston, B.H., D.M. Photiadis, M.H. Marcus, J.A. Bucaro, X.<br />
Liu, J.F. Vignola, Appl. Phys. Lett, Vol. 80, No. 7, 2002, pp.<br />
1300.<br />
[3] Roszhart, T.V., “Micromachined Silicon Resonators,” Electro<br />
International, 1991.<br />
[4] Srikar, V.T. and S.D. Senturia, “Thermoelastic Damping in<br />
Fine-Grained Polysilicon Flexural Beam Resonators,” J.<br />
Microelectromechanical Systems, Vol. 11, No. 5, 2002, pp.<br />
499-504.<br />
[5] Abdolvand, R. et al., “Thermoelastic Damping in Trench-Refilled<br />
Polysilicon Resonators,” Proc. Transducers, Solid-State<br />
Sensors, Actuators and Microsystems, 12 th International<br />
Conference, 2003.<br />
[6] Duwel, A., J. Gorman, M. Weinstein, J. Borenstein, P. Ward,<br />
Sens and Actuators A, Vol. 103, 2003, pp. 70-75.<br />
[7] Zener, C., “Internal Friction in Solids: I. Theory of Internal<br />
Friction in Reeds,” Physical Review, Vol. 52, 1937, p. 230.<br />
[8] Zener, C., “Internal Friction in Solids: II. General Theory of<br />
Thermoelastic Internal Friction,” Physical Review, Vol. 53,<br />
1938, p. 90.<br />
[9] Candler, R.N., M. Hopcroft, W.-T. Park, S.A. Chandorkar, G.<br />
Yama, K.E. Goodson, M. Varghese, A. Duwel, A. Partridge,<br />
M. Lutz, and T. W. Kenny, “Reduction in Thermoelastic Dissipation<br />
in Micromechanical Resonators by Disruption of<br />
Heat Transport,” Proceedings of Solid State Sensors and Actuators,<br />
2004, pp. 45-48.<br />
[10] Nowick, A.S. and B.S. Berry, Analastic Relaxation in Crystalline<br />
Solids, Chapter 17, Academic Press, New York, 1972.<br />
[11] Comsol Multiphysics is a product of Comsol, Inc.<br />
http://www.comsol.com.<br />
[12] Gorman, J., Finite Element Model of Thermoelastic Damping<br />
in MEMS, Master of Science Thesis, Department of Materials<br />
Science, Massachusetts Institute of Technology, 2002.<br />
[13] Antkowiak, B., J.P. Gorman, M. Varghese, D.J.D Carter, A.<br />
Duwel, “Design of a High Q Low Impedance, GHz-Range<br />
Piezoelectric Resonator,” Proc. Transducers, Solid-State Sensors,<br />
Actuators and Microsystems, 12 th International Conference,<br />
2003.<br />
22 Engineering MEMS Resonators with Low Thermoelastic Damping<br />
[14] Schaffler F., Properties of Advanced Semiconductor Materials<br />
GaN, AlN, InN, BN, SiC, SiGe, M.E. Levinshtein, S.L. Rumyantsev,<br />
M.S. Shur, Eds., John Wiley & Sons, Inc., New York,<br />
2001, pp. 149-188.<br />
[15] Quévy, E.P., S.A. Bhave, H. Takeuchi, T-J. King, R.T. Howe,<br />
“Poly-SiGe High Frequency Resonators Based on Lithographic<br />
Definition of Nano-Gap Lateral Transducers,” Proceedings<br />
of Solid State Sensors and Actuators, 2004, pp. 360-363.<br />
[16] Evoy, S., A. Olkhovets, L. Sekaric, J.M. Parpia, H.G. Craighead,<br />
D.W. Carr, “Temperature-Dependent Internal Friction<br />
in Silicon Nanoelectromechanical Systems,” Applied Physics<br />
Letters, Vol. 77, No. 15, 2000, pp. 2397-2399.<br />
[17] http://www.memsnet.org<br />
[18] Roark, Y., Formulas for Stress and Strain, McGraw-Hill, New<br />
York, 1975.<br />
[19] Nowacki, Thermoelasticity, Pergamon Press, Elmsford, New<br />
York, 1962.<br />
[20] Mattilia, T., A. Oja, H. Seppä, O. Jaakkola, J. Kiihamäki, H.<br />
Kattelus, M. Koskenvuori, P. Rantakari, J. Tittonen, “Micromechanical<br />
Bulk Acoustic Wave Resonator,” IEEE Ultrasonics<br />
Symposium, 2002, p. 945.<br />
[21] Abdolvand, R., G. Ho, A. Erbil, F. Ayazi, “Thermoelastic<br />
Damping in Trench-Refilled Polysilicon Resonators,” Proc.<br />
Transducers, Solid-State Sensors, Actuators and Microsystems,<br />
12 th International Conference, 2003.<br />
[22] Ayazi, H., “Thermoelastic Damping in Flexural Mode Ring<br />
Gyroscopes,” 2005 ASME, November 5-11, 2005, Orlando,<br />
FL.<br />
[23] Bindel, D.S. and S. Govindjee, “Elastic PMLs for Resonator<br />
Anchor Loss Simulation,” Int. Journal for Numerical Methods<br />
in Engineering, Vol. 64, No. 6, October 2005, pp. 789-<br />
818.<br />
[24. Bhave, S.A., B.L. Bircumshaw, W-Z. Low, Y-S. Kim, A.P.<br />
Pisano,T-J. King, and R.T. Howe, “Poly-Sige: a High-Q Structural<br />
Material for Integrated RF MEMS,” Solid-State Sensor,<br />
Actuator and Microsystems Workshop, Hilton Head Island,<br />
South Carolina, June 2-6, 2002.<br />
[25] Bindel, D.S., E. Quévy, T. Koyama, S. Govindjee, J.W. Demmel,<br />
and R.T. Howe, “Anchor Loss Simulation in Resonators,”<br />
18 th IEEE Microelectromechanical Systems Conference<br />
(MEMS-05), Miami, Florida, January 30 - February 3,<br />
2005.
(l-r) Amy E. Duwel and<br />
Mathew Varghese<br />
bios<br />
Amy E. Duwel is currently the<br />
MEMS Group Leader at <strong>Draper</strong><br />
<strong>Laboratory</strong> and a Principal<br />
Member of the Technical Staff.<br />
Her technical interests focus on<br />
microscale energy transport and<br />
on the dynamics of MEMS resonators<br />
in applications as inertial sensors, RF filters, and chemical detectors. She received a BA in Physics from the Johns<br />
Hopkins University, Baltimore, MD (1993) and MS and PhD degrees (1995 and 1999, respectively) in Electrical Engineering<br />
and Computer Science from MIT, Cambridge.<br />
Rob N. Candler is a Senior Research Engineer at the Robert Bosch Research and Technology Center. His research has focused<br />
on wafer-level packaging of silicon resonators and inertial sensors and energy dissipation in resonators. He is currently working<br />
on fundamental limitations of MEMS devices under the DARPA Science and Technology Fundamentals Program. He<br />
received a BS in Electrical Engineering from Auburn (2000) and MS and PhD degrees in Electrical Engineering from Stanford<br />
University (2004 and 2006, respectively).<br />
Thomas W. Kenny was with the NASA Jet Propulsion <strong>Laboratory</strong> from 1989 to 1993, where his research focused on the<br />
development of electron-tunneling high-resolution microsensors. In 1994, he joined the Mechanical Engineering Department<br />
at Stanford University, Stanford, CA, where he directs MEMS-based research in a variety of areas including resonators,<br />
wafer-scale packaging, cantilever beam force sensors, microfluidics, and novel fabrication techniques for micromechanical<br />
structures. He is a founder and CTO of Cooligy, a microfluidics chip cooling components manufacturer, and founder and<br />
board member of SiTime, a developer of CMOS timing references using MEMS resonators. He has authored and coauthored<br />
more than 200 scientific papers and holds 40 patents. He is currently the Stanford Bosch Faculty Development Scholar and<br />
the General Chairman of the 2006 Hilton Head Solid-State Sensor, Actuator, and Microsystems Workshop. He received a BS<br />
in Physics from the University of Minnesota (1983) and MS and PhD degrees in Physics from the University of California,<br />
Berkeley (1987 and 1989, respectively).<br />
Mathew Varghese was head of the Microsystems Integration Group and was a Principal Member of Technical Staff at <strong>Draper</strong><br />
<strong>Laboratory</strong>. His research interests focused on the fabrication, design, and analysis of microsystems. He led projects to build<br />
microphones, drug delivery devices, MEMS RF filters, and Chip Scale Atomic Clocks (CSAC). Dr. Varghese won a Distinguished<br />
Performance award for leading the CSAC development effort at <strong>Draper</strong>. He received a BS in Electrical Engineering<br />
and Computer Science with a minor in Physics from the University of California, Berkeley, and SM and PhD degrees in<br />
Electrical Engineering and Computer Science from MIT (1997 and 2001, respectively).<br />
Engineering MEMS Resonators with Low Thermoelastic Damping 23
24<br />
Improving Lunar Return Entry<br />
Footprints Using Enhanced Skip<br />
Trajectory Guidance<br />
Zachary R. Putnam, 1 Robert D. Braun, 2 Sarah H. Bairstow, 3 and Gregory H. Barton 4<br />
Copyright © 2006 The Charles Stark <strong>Draper</strong> <strong>Laboratory</strong>, Inc. Presented at Space 2006 Conference, San Jose, CA,<br />
September 19-21, 2006. Sponsored by AIAA<br />
abstract<br />
The impending development of NASA’s Crew Exploration<br />
Vehicle (CEV) will require a new entry guidance algorithm<br />
that provides sufficient performance to meet all requirements.<br />
This study examined the effects on entry footprints<br />
of enhancing the skip trajectory entry guidance used in the<br />
Apollo program. The skip trajectory entry guidance was<br />
modified to include a numerical predictor-corrector phase<br />
during the atmospheric skip portion of the entry trajectory.<br />
Four degree-of-freedom (DOF) simulation was used to<br />
determine the footprint of the entry vehicle for the baseline<br />
Apollo entry guidance and predictor-corrector enhanced<br />
guidance with both high and low lofting at several lunar<br />
return entry conditions. The results show that the predictor-corrector<br />
guidance modification significantly improves<br />
the entry footprint of the CEV for the lunar return mission.<br />
The performance provided by the enhanced algorithm is<br />
likely to meet the entry range requirements for the CEV.<br />
Introduction<br />
In 2004, the President of the United States fundamentally<br />
shifted the priorities of America’s civil space<br />
program with the Vision for Space Exploration (VSE),<br />
calling for long-term human exploration of the Moon,<br />
Mars, and beyond. [1] This program focuses on returning<br />
astronauts to the Moon by 2020 with the eventual<br />
establishment of a permanent manned station there.<br />
Experience gained from human exploration of the<br />
Moon is then to be used to prepare for a human mission<br />
to Mars. To complete these tasks, a new human exploration<br />
vehicle, the Crew Exploration Vehicle (CEV), will<br />
be developed.<br />
1 Graduate Research Assistant, School of Aerospace Engineering, Georgia Institute of Technology, Atlanta, GA.<br />
2 Associate Professor, School of Aerospace Engineering, Georgia Institute of Technology, Atlanta, GA.<br />
3 <strong>Draper</strong> Fellow, Mission Design and Analysis, <strong>Draper</strong> <strong>Laboratory</strong>.<br />
4 Group Leader, Mission Design and Analysis, <strong>Draper</strong> <strong>Laboratory</strong>.
The NASA Exploration Systems Architecture Study<br />
(ESAS) selected a CEV similar to the Apollo program’s<br />
Command and Service Module, with a crewed<br />
command module and uncrewed service module. [2] The<br />
CEV command module will be a scaled version of the<br />
Apollo Command Module (CM), maintaining the same<br />
outer moldline with a larger radius. In addition, the<br />
CEV will be required to return safely to land locations<br />
during normal operations, as opposed to the ocean<br />
landings performed in the Apollo program. Successful<br />
land recovery operations require an entry guidance<br />
algorithm capable of providing accurate landings over<br />
a large capability footprint. Preliminary requirements<br />
indicate that the CEV entry vehicle must be capable of<br />
downranges of at least 10000 km. [3]<br />
The Apollo program entry guidance contained a longrange<br />
option to provide an abort mode in the event of<br />
poor weather conditions at the primary landing site.<br />
A long-range entry capability also simplifies the phasing<br />
and targeting problem by allowing the vehicle to<br />
perform entry targeting within the atmosphere during<br />
entry, possibly saving propellant during in-space entry<br />
targeting. Long-range entries can be achieved easily by<br />
moderate lift-to-drag ratio (L/D) blunt body entry vehicles,<br />
such as the CEV, by employing a skipping entry<br />
trajectory. When performing a skipping entry, the vehicle<br />
enters the atmosphere and begins to decelerate. The<br />
vehicle then uses aerodynamic forces to execute a pullup<br />
maneuver, lofting the vehicle to higher altitudes,<br />
possibly exiting the atmosphere. However, enough<br />
energy is dissipated during the first atmospheric flight<br />
segment to ensure that the vehicle will enter the atmosphere<br />
a second time at a point significantly farther<br />
downrange than the initial entry point. After the second<br />
entry, the vehicle proceeds to the surface. A longer<br />
range trajectory is achieved in this manner, as shown<br />
in Figure 1.<br />
Attitude (km)<br />
125<br />
100<br />
75<br />
50<br />
25<br />
0<br />
No Skip Entry<br />
Skipping Entry<br />
0 500 1000 1500 2000<br />
Time (s)<br />
Figure 1. Skipping and nonskipping entry trajectories (altitude<br />
vs. time).<br />
The Apollo CM was capable of a maximum entry downrange<br />
without dispersions of 4630 km (2500 nmi)<br />
when employing the Kepler (ballistic) phase of its skip<br />
trajectory guidance. [4 ] However, this capability was<br />
never utilized. Studies for the First Lunar Outpost in<br />
the early 1990s used a 1.05 scale Apollo CM. These<br />
studies also employed the Apollo entry guidance algorithm<br />
and found a similar maximum downrange without<br />
dispersions of 4445 km (2400 nmi). [5] However,<br />
in this study, trajectories using the Kepler phase of the<br />
guidance were excluded from nominal trajectory design<br />
for the following reasons:<br />
(1) Desire to maintain aerodynamic control of the vehicle<br />
throughout entry.<br />
(2) Relative difficulty of accurate manual control<br />
to long-range targets in the event of a guidance<br />
failure.<br />
(3) Sensitivity to uncertainty at atmospheric interface<br />
and within the atmosphere, leading to inaccurate<br />
landings.<br />
(4) No operational necessity for long-range entries. [5]<br />
While these issues remain significant concerns for the<br />
design of the CEV entry system, preliminary requirements<br />
state that the CEV must be able to achieve a downrange<br />
of at least 10,000 km. Recent analyses indicate<br />
that the moldline of the CEV is fully capable of achieving<br />
downranges of this magnitude. [6] However, significant<br />
enhancements in the Apollo algorithm are required<br />
to maintain landed accuracy at these downranges.<br />
Method<br />
The entry footprint of the CEV entry vehicle was evaluated<br />
with a 4-DOF simulation written in Matlab and<br />
Simulink. Entry trajectories were simulated over a<br />
range of flight path angles, crossrange and downrange<br />
commands using the baseline Apollo skip trajectory<br />
guidance and both high and low lofting predictorcorrector<br />
enhanced entry guidance algorithms. Uncertainty<br />
analysis was not included in this feasibility<br />
study.<br />
Definitions<br />
This study utilized the following definitions. Atmospheric<br />
interface, the altitude at which the entry vehicle<br />
enters the sensible atmosphere, was defined to be 122<br />
km (400,000 ft) above the Earth’s reference ellipsoid.<br />
Flight path angle (FPA) refers to the entry vehicle’s inertial<br />
flight path angle at atmospheric interface. The inertial<br />
flight path angle is the angle between the vehicle’s<br />
velocity vector and the local horizontal, where negative<br />
values refer to angles below the horizon. Downrange<br />
is defined as the in-plane distance traveled by the<br />
Improving Lunar Return Entry Footprints Using Enhanced Skip Trajectory Guidance 25
vehicle from atmospheric interface to landing. Crossrange<br />
is defined as the out-of-plane distance traveled<br />
by the vehicle from atmospheric interface to landing.<br />
Miss distance is defined as the distance between the<br />
targeted landing site and the actual landing site. For<br />
the purposes of this study, an acceptable footprint was<br />
defined as the region within which the CM achieved a<br />
miss distance of 3.5 km or less.<br />
Assumptions<br />
Several assumptions were made for the analysis<br />
performed in this study. The atmosphere was assumed<br />
to be the 1962 U.S. Standard Atmosphere to facilitate<br />
comparison with original Apollo program data. All<br />
entries were assumed to be posigrade equatorial. The<br />
entry state used is given in Table 1. The entry vehicle<br />
used was a scaled Apollo CM, as outlined in the<br />
ESAS, [2] with a maximum diameter of 5 m. Hypersonic<br />
blunt body aerodynamics were used, and the vehicle<br />
was flown at trim angle of attack, generating a lift-todrag<br />
ratio (L/D) of 0.4. Entry vehicle properties are<br />
summarized in Table 2.<br />
Table 1. Vehicle Entry State.<br />
Parameter Value<br />
Inertial Velocity 11032 m/s<br />
Altitude 122 km<br />
Longitude 0 deg<br />
Latitude 0 deg<br />
Azimuth 90 deg<br />
Table 2. Vehicle Properties.<br />
Parameter Value<br />
Mass 8075 kg<br />
Reference Area 23.758 m 2<br />
L/D 0.4<br />
Parameters Varied<br />
Crossrange commands were varied between 0 km and<br />
1000 km; downrange commands were varied between<br />
1500 km and 13000 km. This set of commands fully<br />
captured the capability footprint of the entry vehicle.<br />
Three flight path angles were selected to examine vehicle<br />
footprints over a range of atmospheric interface<br />
conditions, as shown in Table 3. Two of the FPAs were<br />
selected based on a CEV emergency ballistic entry (EBE)<br />
study conducted at the Charles Stark <strong>Draper</strong> <strong>Laboratory</strong><br />
in September 2005. This set of parameters was<br />
used with both the baseline skip trajectory guidance<br />
and the high and low lofting versions of the enhanced<br />
skip trajectory guidance.<br />
26 Improving Lunar Return Entry Footprints Using Enhanced Skip Trajectory Guidance<br />
Table 3. Flight Path Angle Selections.<br />
FPA Selection Criteria<br />
-5.635 deg Center of aerodynamic corridor<br />
-5.900 deg Approximate shallow boundary for EBE<br />
-6.100 deg Approximate steep boundary for EBE<br />
results: Baseline algorithm<br />
Baseline Algorithm Description<br />
The primary function of the entry guidance algorithm<br />
is to manage energy as the spacecraft descends to the<br />
parachute deploy interface. The bank-to-steer algorithm<br />
controls lift in the coupled vertical and lateral channels,<br />
with guidance cycles occurring at a frequency of 0.5<br />
Hz.<br />
Guidance’s chief goal is to manage lift in the vertical channel<br />
so that the vehicle enters into the wind-corrected parachute<br />
deploy box at the appropriate downrange position.<br />
For a given FPA, full lift-up provides maximum range while<br />
full lift-down provides the steepest descent. Lift-down may<br />
be constrained by the maximum allowed g-loads that can<br />
be experienced by the crew and vehicle. Any bank orientation<br />
other than full lift-up or full lift-down will result<br />
in a component of lift in the lateral channel. Crossrange<br />
position is controlled in the lateral channel by reversing<br />
the lift command into the mirror quadrant (e.g., +30 deg<br />
from vertical to -30 deg) once the lateral range errors to the<br />
target cross a threshold. The vehicle continues this bank<br />
command reversal strategy as it descends to the target. As<br />
the energy and velocity decrease, the lateral threshold is<br />
reduced so that the vehicle maintains control authority to<br />
minimize the lateral errors prior to chute deploy.<br />
The baseline Apollo algorithm consists of seven phases<br />
designed to control the downrange position of the vehicle,<br />
as shown in Figure 2.<br />
Altitude (km)<br />
140<br />
120<br />
100<br />
80<br />
60<br />
40<br />
20<br />
0<br />
Initial Roll & Constant Drag<br />
Huntest & Constant Drag<br />
Down Control<br />
Up<br />
Control<br />
Targets<br />
Exit<br />
Conditions<br />
Kepler 2 nd Entry<br />
0 2000 4000 6000 8000<br />
Downrange Travelled (km)<br />
Figure 2. Baseline algorithm entry guidance phases.
(1) Preentry Attitude Hold: maintains current attitude<br />
until a sensible atmosphere has been detected.<br />
(2) Initial Roll: seeks to guide the vehicle toward the<br />
center of the entry corridor, nominally commanding<br />
the lift vector upward, otherwise commanding<br />
the lift vector downward to steepen a shallow<br />
entry.<br />
(3) Huntest and Constant Drag: begins once atmospheric<br />
capture is ensured, triggered by an altitude<br />
rate threshold. This phase determines whether the<br />
vehicle will need to perform an upward “skip” in<br />
order to extend the vehicle’s range, decides which<br />
of the possible phases to use, and calculates the<br />
conditions that will trigger those phases. The<br />
algorithm transitions to the Downcontrol phase<br />
once a suitable skip trajectory is calculated; otherwise,<br />
the algorithm transitions directly to the Final<br />
(“Second Entry”) phase if no skip is needed.<br />
(4) Downcontrol: guides the vehicle to pullout using a<br />
constant drag policy.<br />
(5) Upcontrol: guides the vehicle along a reference<br />
trajectory, previously generated by the Huntest<br />
phase. This trajectory is not updated during the<br />
Upcontrol phase. The algorithm transitions into the<br />
Kepler phase if the skip trajectory is large enough<br />
to exit the atmosphere; otherwise, the algorithm<br />
transitions directly into the Final (“Second Entry”)<br />
phase.<br />
(6) Kepler (“Ballistic”): maintains current attitude<br />
along the velocity vector from atmospheric exit to<br />
atmospheric second entry. Exit and second entry<br />
transitions are defined to occur at an aerodynamic<br />
acceleration of 0.2 g.<br />
(7) Final (“Second Entry”): guides the vehicle along<br />
a stored nominal reference trajectory, calculated<br />
preflight. Once the velocity drops below<br />
a threshold value, the algorithm stops updating<br />
bank commands and the guidance algorithm is<br />
disabled.<br />
The guidance phases and phase-transition logic are<br />
discussed fully in Reference [7].<br />
Results Summary<br />
The results presented below are given in footprint plots.<br />
These plots show the miss distance associated with a<br />
particular downrange and crossrange command. Dark<br />
blue areas indicate accurate landings, while red areas<br />
indicate large miss distances. Light blue and dark blue<br />
areas provide acceptable accuracy, corresponding to<br />
miss distances of 3.5 km or less. It should be noted that<br />
red areas denote miss distance of 10 km or greater, with<br />
some miss distances in excess of 1000 km.<br />
Baseline Algorithm Results<br />
The entry guidance algorithm used for the Apollo<br />
program was selected as the baseline algorithm for<br />
the CM entry guidance. Figures 3-5 show the landed<br />
accuracy over a range of downrange and crossrange<br />
commands for several FPAs (see Table 3). Figure 4<br />
shows the footprint outlines at several FPAs.<br />
Figure 3 shows the footprint for the baseline algorithm<br />
at an FPA of -5.635 deg. Maximum crossrange is<br />
approximately ±700 km. Minimum downrange is 2250<br />
km; maximum downrange is 7000 km. Within these<br />
ranges, the algorithm performs well. Figure 4 shows the<br />
footprint for the baseline algorithm at an FPA of -5.900<br />
deg. Performance remains similar at this FPA. The minimum<br />
downrange decreases to 2000 km, while the maximum<br />
downrange remains 7000 km, with the exception<br />
of crossranges less than ±50 km. Some improvement is<br />
made in long-range performance, but accurate regions<br />
are patchy. Figure 5 shows the footprint for the baseline<br />
algorithm at an FPA of -6.100 deg. Significant performance<br />
improvements are visible at this FPA. Maximum<br />
downrange increases to 7500 km; minimum downrange<br />
is 2000 km. Maximum crossrange increases to ±750 km<br />
at large downranges. Long-range performance becomes<br />
accurate in two regions at crossranges greater than 400<br />
km.<br />
Crossrange Command (km)<br />
1000<br />
800<br />
600<br />
400<br />
200<br />
0<br />
-200<br />
-400<br />
-600<br />
-800<br />
-1000<br />
2000 4000 6000 8000 10000 12000<br />
Downrange Command (km)<br />
Figure 3. Baseline miss distance (km) with FPA = -5.635 deg.<br />
Improving Lunar Return Entry Footprints Using Enhanced Skip Trajectory Guidance 27<br />
10+<br />
9<br />
8<br />
7<br />
6<br />
5<br />
4<br />
3<br />
2<br />
1<br />
0
Crossrange Command (km)<br />
Figure 4. Baseline miss distance (km) with FPA = -5.900 deg.<br />
Crossrange Command (km)<br />
Figure 5. Baseline miss distance (km) with FPA = -6.100 deg.<br />
Overall, the baseline algorithm provides good performance<br />
over downrange commands between 2000 km and 7000 km<br />
with crossranges up to 700 km, as shown in Figure 6. However,<br />
improvement is required for long-range performance.<br />
Crossrange Command (km)<br />
1000<br />
800<br />
600<br />
400<br />
200<br />
0<br />
-200<br />
-400<br />
-600<br />
-800<br />
-1000<br />
1000<br />
800<br />
600<br />
400<br />
200<br />
0<br />
-200<br />
-400<br />
-600<br />
-800<br />
-1000<br />
1000<br />
800<br />
600<br />
400<br />
200<br />
0<br />
-200<br />
-400<br />
-600<br />
-800<br />
-1000<br />
2000 4000 6000 8000 10000 12000<br />
Downrange Command (km)<br />
2000 4000 6000 8000 10000 12000<br />
Downrange Command (km)<br />
FPA = -5.653 deg<br />
FPA = -5.900 deg<br />
FPA = -6.100 deg<br />
Figure 6. Baseline range capability over several FPAs, miss<br />
distance
Next, the Final phase reference trajectory was redefined<br />
and extended to recenter it with respect to the CEV’s<br />
range capability, since the CEV has different vehicle<br />
characteristics from the Apollo CM. Finally, the Final<br />
phase range estimation method used by the Huntest and<br />
PredGuid phases was updated to enable the new Final<br />
phase reference trajectory to support a wider spread<br />
of target ranges. More detail about the enhancements<br />
made to the algorithm is available in Reference [9].<br />
The affects of modulating the start time of the PredGuid<br />
phase was also investigated. A comparison was made<br />
between starting the PredGuid phase at the beginning<br />
of the Upcontrol Phase (as described above) and starting<br />
the PredGuid phase at the beginning of the Downcontrol<br />
phase. The difference in these two approaches<br />
resulted in different trajectory shaping. Starting the<br />
PredGuid phase at the nominal time by replacing the<br />
Upcontrol and Kepler phases resulted in a lower-altitude,<br />
shallower skip trajectory. Starting the PredGuid<br />
phase earlier by also replacing the Downcontrol phase<br />
resulted in a higher-altitude, steeper lofting.<br />
Enhanced Algorithm Results<br />
The results presented below detail the entry footprint of<br />
the CM using the enhanced numerical predictor-corrector<br />
guidance algorithm with both high and low lofting.<br />
Figures 8-13 show the landed accuracy, in terms<br />
of miss distance, of the CM at various downrange and<br />
crossrange commands for a given FPA. Figures 11 and<br />
12 show the footprint outlines for high and low lofts<br />
for several FPAs.<br />
Figure 8 shows the footprint for a low loft at an FPA of<br />
-5.635 deg. The CM achieves a maximum crossrange<br />
of approximately ±750 km. The minimum downrange<br />
is 2250 km and significant accuracy is lost when<br />
downranges greater than 10000 km are targeted. The<br />
footprint for a low loft at an FPA of -5.900 deg is shown<br />
in Figure 9. The CM achieves a maximum crossrange of<br />
±850 km, an increase of 100 km over the -5.635 deg case.<br />
The minimum downrange decreases to 2000 km from<br />
2500 km in the -5.635 deg case. Significant accuracy<br />
is still lost when downranges greater than 10000 km<br />
are targeted. The footprint for a low loft at an FPA of<br />
-6.100 deg is nearly identical to that of the -5.900 deg<br />
case (Figure 10). Of note is the much larger red region<br />
starting at 11000 km, indicating a deterioration of longrange<br />
performance with steepening FPA.<br />
Crossrange Command (km)<br />
1000<br />
800<br />
600<br />
400<br />
200<br />
0<br />
-200<br />
-400<br />
-600<br />
-800<br />
-1000<br />
2000 4000 6000 8000 10000 12000<br />
Downrange Command (km)<br />
Figure 8. Low loft miss distance (km) with FPA = -5.635 deg.<br />
Crossrange Command (km)<br />
Figure 9. Low loft miss distance (km) with FPA = -5.900 deg.<br />
Crossrange Command (km)<br />
1000<br />
800<br />
600<br />
400<br />
200<br />
0<br />
-200<br />
-400<br />
-600<br />
-800<br />
-1000<br />
2000 4000 6000 8000 10000 12000<br />
Downrange Command (km)<br />
1000<br />
800<br />
600<br />
400<br />
200<br />
0<br />
-200<br />
-400<br />
-600<br />
-800<br />
-1000<br />
2000 4000 6000 8000 10000 12000<br />
Downrange Command (km)<br />
Figure 10. Low loft miss distance (km) with FPA = -6.100 deg.<br />
Improving Lunar Return Entry Footprints Using Enhanced Skip Trajectory Guidance 29<br />
10+<br />
9<br />
8<br />
7<br />
6<br />
5<br />
4<br />
3<br />
2<br />
1<br />
0<br />
10+<br />
9<br />
8<br />
7<br />
6<br />
5<br />
4<br />
3<br />
2<br />
1<br />
0<br />
10+<br />
9<br />
8<br />
7<br />
6<br />
5<br />
4<br />
3<br />
2<br />
1<br />
0
Figure 11 shows the footprint for a high loft at an FPA<br />
of -5.635 deg. The CM achieves a maximum crossrange<br />
of approximately ±900 km, a 150-km increase over the<br />
low loft case. The minimum downrange is 2250 km and<br />
the maximum downrange is 11250 km. No accuracy is<br />
lost between 10000 km and 11250 km as in the low loft<br />
case. The footprint for a high loft at an FPA of -5.900 deg<br />
is slightly better (Figure 12). The CM achieves a maximum<br />
crossrange of ±950 km. The minimum downrange<br />
is 2000 km and the maximum downrange is 11000 km,<br />
slightly less than the -5.635 deg case. Of particular note<br />
are two regions of inaccuracy near 3000 km downrange.<br />
Figure 13 shows the footprint for a high loft at an FPA<br />
of -6.100 deg. The CM achieves a maximum crossrange<br />
of ±900 km. Downrange performance is similar to the<br />
-5.900 deg case. The two inaccurate regions near 3000<br />
km downrange have disappeared at this FPA.<br />
Crossrange Command (km)<br />
1000<br />
800<br />
600<br />
400<br />
200<br />
0<br />
-200<br />
-400<br />
-600<br />
-800<br />
-1000<br />
2000 4000 6000 8000 10000 12000<br />
Downrange Command (km)<br />
Figure 11. High loft miss distance (km) with FPA = -5.635<br />
deg.<br />
Crossrange Command (km)<br />
1000<br />
800<br />
600<br />
400<br />
200<br />
0<br />
-200<br />
-400<br />
-600<br />
-800<br />
-1000<br />
2000 4000 6000 8000 10000 12000<br />
Downrange Command (km)<br />
Figure 12. High loft miss distance (km) with FPA = -5.900<br />
deg.<br />
30 Improving Lunar Return Entry Footprints Using Enhanced Skip Trajectory Guidance<br />
10+<br />
9<br />
8<br />
7<br />
6<br />
5<br />
4<br />
3<br />
2<br />
1<br />
0<br />
10+<br />
9<br />
8<br />
7<br />
6<br />
5<br />
4<br />
3<br />
2<br />
1<br />
0<br />
Crossrange Command (km)<br />
1000<br />
800<br />
600<br />
400<br />
200<br />
0<br />
-200<br />
-400<br />
-600<br />
-800<br />
-1000<br />
2000 4000 6000 8000 10000 12000<br />
Downrange Command (km)<br />
Figure 13. High loft miss distance (km) with FPA = -6.100<br />
deg.<br />
Figures 14 and 15 show the footprints for low and<br />
high loft trajectories, respectively, at three FPAs. The<br />
footprint outlines correspond to miss distances of 3.5<br />
km or less. As shown before, -5.900 deg and -6.100<br />
deg provide similar performance, while -5.635 deg is<br />
slightly less capable. All trajectories begin to lose accuracy<br />
beyond 10000 km. As in the low loft cases, the<br />
performance of the high loft -5.900 deg and -6.100<br />
deg cases is similar, with the exception of the two inaccurate<br />
regions in the -5.900 deg case near 3000 km<br />
downrange. The -5.635 deg case is slightly less capable<br />
in minimum downrange and maximum crossrange, but<br />
slightly more capable in maximum downrange, providing<br />
capability to 11250 km.<br />
Crossrange Command (km)<br />
1000<br />
800<br />
600<br />
400<br />
200<br />
0<br />
-200<br />
-400<br />
-600<br />
-800<br />
-1000<br />
FPA = -5.635 deg<br />
FPA = -5.900 deg<br />
FPA = -6.100 deg<br />
2000 3000 4000 5000 6000 7000 8000 9000 10000 11000 12000 13000<br />
Downrange Command (km)<br />
Figure 14. Low loft footprints for several FPAs, miss<br />
distance
Crossrange Command (km)<br />
1000<br />
800<br />
600<br />
400<br />
200<br />
0<br />
-200<br />
-400<br />
-600<br />
-800<br />
-1000<br />
FPA = -5.635 deg<br />
FPA = -5.900 deg<br />
FPA = -6.100 deg<br />
2000 3000 4000 5000 6000 7000 8000 9000 10000 11000 12000 13000<br />
Downrange Command (km)<br />
Figure 15. High loft footprints for several FPAs, miss<br />
distance
eferences<br />
[1] The White House Website Presidential News and Speeches,<br />
“President Bush Announces New Vision for Space Exploration<br />
Program,” URL: http://www.whitehouse.gov/news/releases/2004/01/20040114-3.html,<br />
October 26, 2005.<br />
[2] Exploration Systems Architecture Study Final Report, NASA<br />
TM-2005-214062, November 2005.<br />
[3] NASA Solicitation: Conceptual Design of an Air Bag Landing<br />
Attenuation System for the Crew Exploration Vehicle, Langley<br />
Research Center Press Release, December 14, 2005.<br />
[4] Graves, C.A. and J.C. Harpold, Reentry Targeting Philosophy<br />
and Flight Results from Apollo 10 and 11, MSC 70-FM-48,<br />
March 1970.<br />
[5] Tigges, M. et al., Earth Land-Landing Analysis for the First<br />
Lunar Outpost Mission: Apollo Configuration, NASA JSC-<br />
25895, June 1992.<br />
[6] Putnam, Z.R. et al. “Entry System Options for Human Return<br />
from the Moon and Mars,” AIAA 2005-5915, AIAA Atmospheric<br />
Flight Mechanics Conference, San Francisco, CA,<br />
August 2005.<br />
[7] Morth, R., Reentry Guidance for Apollo, MIT/IL R-532 Vol. I,<br />
1966.<br />
[8] DiCarlo, J.L., Aerocapture Guidance Methods for High Energy<br />
Trajectories, SM Thesis, Department of Aeronautics and<br />
Astronautics, MIT, June 2003.<br />
[9] Bairstow, S.H., Reentry Guidance with Extended Range Capability<br />
for Low L/D Spacecraft, SM Thesis, Department of<br />
Aeronautics and Astronautics, MIT, February 2006.<br />
32 Improving Lunar Return Entry Footprints Using Enhanced Skip Trajectory Guidance
(l-r) Zachary R. Putnam,<br />
Gregg H. Barton and<br />
Robert D. Braun<br />
bios<br />
Zachary R. Putnam performed<br />
his graduate<br />
research work in the area<br />
of entry system design<br />
and performance. He<br />
currently supports the<br />
development of skip entry guidance for NASA’s Crew Exploration Vehicle at <strong>Draper</strong>’s Johnson Space Center field site. He<br />
holds an MS in Aerospace Engineering from Georgia Tech.<br />
Robert D. Braun is an Associate Professor in the Guggenheim School of Aerospace Engineering at the Georgia Institute of<br />
Technology. As Director of Georgia Tech’s Space Systems Design <strong>Laboratory</strong>, he leads a research and education program<br />
focused on the design of advanced flight systems and technologies for planetary exploration. In addition, Dr. Braun<br />
provides consulting services in the areas of space systems engineering and analysis, planetary entry, and Mars atmospheric<br />
flight. He has provided independent analysis and review services for the Mars Global Surveyor, Mars Odyssey, Mars<br />
Exploration Rover, Genesis, Phoenix Mars Scout, and Mars Science <strong>Laboratory</strong> flight projects. Dr. Braun received a BS in<br />
Aerospace Engineering from Penn State (1987), an MS in Astronautics from the George Washington University (1989),<br />
and a PhD in Aeronautics and Astronautics from Stanford University (1996).<br />
Sarah H. Bairstow performed her Master’s thesis research on the topic of reentry guidance algorithms for low L/D spacecraft<br />
as a <strong>Draper</strong> Fellow under the advisement of Gregg Barton, after which she began full-time employment at <strong>Draper</strong> to<br />
expand on that research. She has been employed since June 2006 as a Space Mission Systems Concept Analyst at the Jet<br />
Propulsion <strong>Laboratory</strong> in Pasadena, CA. She received an MS in Aeronautics and Astronautics from MIT (2006).<br />
Gregg H. Barton has been with the <strong>Laboratory</strong> since 1985 and is currently the Group Leader for the Mission Design and<br />
Analysis for Earth, Moon, and Mars GN&C systems, and the <strong>Draper</strong> Project Lead for Skip Guidance Technologies for<br />
Earth return vehicles. Responsibility over the years includes all levels of project development from requirements and<br />
interfaces, concept design and analysis, algorithm and software development, and test and verification for flight certification.<br />
Management duties have included all levels from task lead, project lead, technical director, proposal manager to<br />
program manager. In addition to these duties, he has served as technical supervisor and mentor for new staff and MIT<br />
graduates.<br />
Improving Lunar Return Entry Footprints Using Enhanced Skip Trajectory Guidance 33
34<br />
A Deep Integration Estimator<br />
for Urban Ground Navigation<br />
Dale Landis, Tom Thorvaldsen, Barry Fink, Peter Sherman, Steven Holmes<br />
Copyright © 2006, IEEE. Presented at IEEE PLANS, San Diego, CA, April 25-27, 2006<br />
abstract<br />
The objective of the Personal Navigator System (PNS) is to<br />
construct a wearable navigation system that provides accurate<br />
position over extended missions in a deprived Global<br />
Positioning System (GPS) environment. The prototype<br />
multisensor navigator included a set of micromechanical<br />
inertial sensors, a three-axis miniature radar, a selective<br />
availability antispoofing module (SAASM) GPS receiver,<br />
and a barometric altimeter. Real-time embedded software<br />
sampled sensor data, controlled GPS receiver tracking<br />
loops, and hosted a multisensor optimal estimator whose<br />
output position was transmitted via wireless link to a highresolution<br />
personal data accessory (PDA) tracking display.<br />
The fully packaged system was field tested in Cambridge,<br />
Massachusetts under realistic, GPS-stressed conditions.<br />
This paper focuses on the deep integration (DI) algorithm<br />
design used for the optimal estimation of both position<br />
and receiver tracking control. The algorithm was tailored<br />
here for intermittent GPS visibility on the ground and in<br />
outdoor-indoor-outdoor maneuvers. DI has been used<br />
previously for missile guidance, navigation, and control<br />
with clear sky view.<br />
The PNS required an optimal estimator that combined<br />
the nonlinear GPS/inertial DI algorithm with measurements<br />
from other sensors. The mission duration here<br />
was much longer, and the satellite environment over the<br />
ground track was highly variable compared with earlier<br />
DI applications. This required the development of strategies<br />
for dropping satellites from track after long blockage<br />
times and for taking control of newly visible satellites<br />
under DI tracking. Here, the advantage of DI tracking<br />
is the ability to extract GPS pseudorange information<br />
almost instantly if a satellite reappears momentarily from<br />
a blockage.<br />
This paper reviews the DI approach with stress on the<br />
receiver correlator power measurements, nonlinear filter<br />
equations, and the calculation of numerically-controlled<br />
oscillator (NCO) commands. Specific problems encountered,<br />
such as clock error recalculation and numerical<br />
issues, will be mentioned. Urban canyon performance data<br />
demonstrating accurate navigation under sparse GPS availability<br />
are also described.
Introduction<br />
The PNS is a small package containing a <strong>Draper</strong> <strong>Laboratory</strong><br />
micromechanical inertial measurement unit (IMU), a Rockwell<br />
Collins GPS receiver, a triad of Doppler radar velocity<br />
sensors, a barometric altimeter, a PDA that allows human<br />
user interface, and a processor that contains <strong>Draper</strong>-developed,<br />
real-time navigation software. This package is wearable<br />
in a front-mounted configuration by a foot soldier, and<br />
its objective is to provide long-term accurate coordinates in<br />
both outdoor and indoor environments, including significant<br />
periods of GPS signal deprivation.<br />
The software comprises strapped-down navigation algorithms<br />
combined with <strong>Draper</strong>’s deep integration (DI) nonlinear filter<br />
for processing GPS correlator outputs, based on previous<br />
<strong>Draper</strong> munitions shell applications. Doppler updates, navigation<br />
initialization, and satellite line-of-sight (LOS) error estimation<br />
were among the many features added for the application.<br />
Demonstration in a full hardware mode was done in Spring<br />
2005. An example is shown in Figure1.<br />
Up (ft)<br />
Position NEU<br />
Recorded 3-D Track<br />
In-Building<br />
GPS-Denied<br />
20<br />
0<br />
-20<br />
Finish<br />
-40<br />
-60<br />
-80<br />
200<br />
450<br />
400<br />
150100 Rooftop Start<br />
350<br />
300<br />
50 Sky in Full View 250<br />
0<br />
200<br />
150<br />
East (ft) -50 100<br />
50<br />
North (ft)<br />
-100<br />
0<br />
Figure 1. Real-time PNS test results in Technology Square,<br />
Cambridge.<br />
The test illustrated involved an outdoor phase followed<br />
by an indoor GPS-deprived period. Figure 1 shows that<br />
position accuracy was maintained, even during the indoor<br />
phase. An overlay of the recorded track onto geolocated<br />
floor plans showed very good registration with hallways.<br />
In the vertical direction, stairwell landings are clearly seen.<br />
The PNS effectively locates the user to the correct floor.<br />
The tests also showed that on return to the outdoor environment,<br />
GPS resumed almost immediately. Results of this<br />
test program were reported at JNC’05. [1]<br />
The algorithm that accomplished this performance is<br />
surveyed in subsequent sections, with emphasis on the<br />
components that required fresh techniques.<br />
Navigation algorithm and related Calculations<br />
The inputs to the navigation algorithm are 100-Hz sampled<br />
specific force (accelerometers) and rate (gyroscopes) in a<br />
PNS orthogonal body-fixed frame that is designated by b<br />
in this paper. The core of the PNS navigation algorithm is a<br />
standard strapped-down integration algorithm comprising<br />
IMU compensation, quaternion third-order integration,<br />
gravity compensation of accelerometer outputs, and velocity<br />
and position integration in earth-fixed, earth-centered<br />
(ecef or e) coordinates. For future reference, the navigation<br />
major outputs are:<br />
= position e frame<br />
= velocity e frame<br />
q = quaternion b to e<br />
= direction cosine matrix<br />
Navigation initialization, omitting many details, is as<br />
follows. The receiver begins with conventional acquisition<br />
and tracking, downloads ephemeris, and sends a position<br />
and velocity to navigation. A crude azimuth estimate<br />
is made by assuming an initial north and level orientation<br />
(accuracy of 10 deg in azimuth is sufficient). Once<br />
the receiver enters deep integration mode (less than a<br />
minute), the wearer moves horizontally, and the filter is<br />
able to refine the attitude estimates sufficiently for continued<br />
operation using the difference between IMU- and GPSdetermined<br />
accelerations. Current work at <strong>Draper</strong> includes<br />
more advanced forms of attitude initialization that impose<br />
less artificial restraints on the PNS wearer.<br />
In addition to navigation proper, there are calculations that<br />
keep track of optimal estimates of other quantities, primarily<br />
the following:<br />
dtR = user (receiver) clock bias<br />
d = user clock frequency error<br />
db k = LOS delay error satellite k<br />
An error filter based on perturbation of the navigation algorithm<br />
is used to process all the measurements. The filter<br />
states are listed for future reference in Table 1.<br />
Table 1. PNS Filter States.<br />
Error States Units<br />
Position dr 3 chips<br />
Velocity dv 3 chips/s<br />
Attitude y 3 rad<br />
Gyro Bias Shift 3 rad/s<br />
Gyro Bias Markov 3 rad/s<br />
Accel. Bias Shift 3 chips/s 2<br />
Accel. Bias Markov 3 chips/s 2<br />
User Clock Bias 1 chips<br />
User Clock Frequency 1 chips/s<br />
Doppler Misalignment (6) 6 rad<br />
Satellite Delay 12 chips<br />
Altimeter Bias 1 chips<br />
A Deep Integration Estimator for Urban Ground Navigation 35
The chip units are defined for P code (which is used in<br />
PNS) by 96.146 ft/chip or 9.775 x 10 -8 s/chip.<br />
The filter performs the GPS DI updates plus Kalman<br />
updates for the other sensors. A set of corrections for<br />
the navigation system and clock model are computed<br />
and then fed back to the navigation algorithm for a<br />
reset of the full system state.<br />
The algorithm-embedded software is coded in three rate<br />
groups: high (100 Hz), medium (50 Hz), and low (10<br />
Hz). High rate performs IMU compensation, attitude<br />
integration, and incremental transition matrix calculations.<br />
Medium rate performs navigation position and<br />
velocity integration, bookkeeping of the receiver clock<br />
error estimate and satellite atmospheric delay estimates,<br />
and all GPS receiver interfacing (described below).<br />
Both high and medium rate perform resets based on<br />
corrections supplied by the nonlinear filter. Low rate<br />
performs all filter updates and sends corrections to high<br />
and medium rate.<br />
Deep Integration GPs<br />
Background of <strong>Draper</strong>’s Deep Integration<br />
DI was developed to extend GPS tracking to poor<br />
GPS signal-to-noise conditions, especially intentional<br />
jamming environments. Deep integration requires<br />
a custom receiver configured so that the navigation<br />
software can issue the numerically controlled oscillator<br />
(NCO) commands (overriding the internal tracking<br />
loops) and also receive integrated correlator outputs.<br />
For previous results with DI, see Ref. [2].<br />
Prior to PNS, <strong>Draper</strong> DI was used successfully in artillery<br />
shells with high dynamics and short duration, where<br />
the instrumentation was limited to inertial sensors and<br />
the receiver.<br />
For the personal navigator, <strong>Draper</strong> extended the use<br />
of DI in significant ways. First, mission duration in<br />
the tests was stretched from minutes to one half hour.<br />
There is no inherent mission duration limitation here.<br />
Second, the capability of the nonlinear algorithm was<br />
extended to perform both the nonlinear GPS updates and<br />
conventional Kalman updates (from the Doppler radar<br />
and altimeter). In contrast to the fixed set of satellites in<br />
view for a short time-of-flight missile, the ground navigation<br />
system described here needed to adapt to satellite<br />
configuration changes. Finally, of course, this was<br />
all done with hardware compressed to a point practical<br />
for use by a foot soldier.<br />
A key advantage of DI for the ground navigation application<br />
is the ability to recover satellite track after signal<br />
36 A Deep Integration Estimator for Urban Ground Navigation<br />
is temporarily lost, perhaps due to masking from a<br />
landscape fixture. A second advantage is that deep integration,<br />
by design, is able to track a satellite when its<br />
power is weaker, due to factors such as forest canopy or<br />
indoor attenuation.<br />
Summary and Technical Overview<br />
In conventional operation, the GPS receiver is based<br />
on internal tracking loops, in which tracking loops are<br />
maintained for GPS code and carrier signals, based on<br />
correlator outputs and NCO commands, both of which<br />
are invisible to the end user. The user is supplied with<br />
pseudo and delta range information tapped from these<br />
loops, or final position and velocity. Conventional GPS<br />
is covered in numerous sources, among which Ref. [3]<br />
may be cited.<br />
In deep integration, the correlator outputs are issued to<br />
the navigation processor, along with a code phase (or<br />
equivalently, pseudorange) for the replica signal. The<br />
navigation software sends rate commands to the receiver<br />
NCOs, which the receiver uses to generate the replica<br />
signal. This operation replaces the internal loops.<br />
In practice, there is an alternation between modes in<br />
PNS. Sometimes (initially and during extended signal<br />
loss), the receiver maintains control of tracking loops.<br />
Whenever possible, internal loops are replaced by the<br />
DI process. These modes are referred to as “receiver<br />
control” (internal loops) and “host control” (deep<br />
integration).<br />
Description of PNs Deep Integration<br />
A compressed technical summary of deep integration<br />
can be given by reference to the main interfaces in PNS,<br />
shown in Figure 2. First, the code and carrier NCO<br />
commands issued to the receiver are discussed in detail.<br />
Then the receiver outputs sent to navigation and their<br />
transformation into filter observations are discussed.<br />
Finally, the filter corrections applied to the navigator<br />
are discussed.<br />
GPS<br />
Receiver<br />
I, Q, r*<br />
50 Hz<br />
. .<br />
tcode , tcarr Navigation<br />
Medium<br />
Rate<br />
10 Hz<br />
Corrections<br />
Figure 2. Deep integration interfaces in PNS.<br />
dz<br />
PNS Processor<br />
Navigation<br />
Low<br />
Rate
The 50-Hz rate command that the navigator gives to the<br />
code NCO is a code phase rate, which may be given in<br />
speed of light units as:<br />
where tcorr is a “correction” to bring the code phase to<br />
the navigation predicted position, and the reflects<br />
navigation predicted rate. Dt is the time interval of the<br />
NCO command application (20 ms).<br />
The correction term, also referred to as the NCO “poke,”<br />
is represented by:<br />
where<br />
= user time bias estimate<br />
= range-to-satellite estimate<br />
= atmospheric delay estimate<br />
= satellite clock bias estimate<br />
r* = replica code pseudorange<br />
The range term is calculated from navigation position,<br />
and the clock error is derived from the navigation filter.<br />
r* is the receiver-supplied pseudorange.<br />
It is instructive to see a derivation of this command.<br />
Navigation information may be used to calculate the<br />
time (referenced to the satellite clock) of transmission<br />
of a light pulse currently received, which is the calculated<br />
satellite signal code phase. This is:<br />
where tR is receiver user time. The receiver sends a<br />
measured replica code pseudorange, from which the<br />
replica code phase may be calculated as:<br />
t* = tR – r* (4)<br />
The goal is to drive the replica code to a phase where,<br />
according to navigation and clock estimates, it would<br />
match the incoming code from the satellite. The alteration<br />
of code phase that accomplishes this is:<br />
tcorr = tcalc – t (5)<br />
If Eqs. (3) and (4) are substituted into Eq. (5), the result<br />
is precisely Eq. (2).<br />
(1)<br />
(2)<br />
(3)<br />
The second term (also called the “push”) in the command<br />
is:<br />
where<br />
= user time frequency error estimate<br />
A Deep Integration Estimator for Urban Ground Navigation 37<br />
(6)<br />
= range rate estimate (from navigation velocity)<br />
= satellite clock frequency error estimate<br />
In the current DI configuration, the carrier NCO is also<br />
commanded by the push term derived above. This is<br />
sufficient to maintain the accuracy of the P code tracking,<br />
which is the primary information source for the<br />
PNS.<br />
Note that these commands have the following effect:<br />
replica code is lined up with navigation prediction. As<br />
a consequence, the correlator information will make the<br />
navigation errors (including PNS clock error estimates)<br />
directly observable. This forced observability of navigation<br />
error in I and Q (in phase and quadrature) output<br />
is fundamental to deep integration.<br />
Using the NCO commands to generate the replica code,<br />
the receiver produces I and Q integrated correlator<br />
outputs in the standard way. (See for example Ref. [3].)<br />
As shown in Figure 2, the receiver sends these I and Q<br />
data, integrated over 20-ms intervals, to the navigation<br />
medium rate function. At each time, these are indexed<br />
over the satellite set (N) and over the number of correlators,<br />
T = 2K + 1 (5 for PNS).<br />
The navigation medium rate task compresses these by<br />
summing their squares over five time samples. Using<br />
i for the time index (i = 1,...,5), k for the correlation<br />
index (k = 1,...,T), and suppressing the satellite<br />
(receiver channel) index, the measurement is:<br />
For each 100-ms interval, this gives a T-element vector<br />
measurement (in contrast to conventional loops that<br />
form a scalar measurement, gaining local linearity at the<br />
cost of information). The vector measurement for one<br />
satellite for one 10-Hz filter pass is readily derived from<br />
standard equations for I and Q data giving:<br />
(7)
where<br />
dt = 20 ms<br />
S = signal power<br />
R = pseudorandom code correlation function<br />
e = LOS delay error in chips<br />
D = correlator spacing = 0.5 chip<br />
b = bias<br />
n = noise<br />
The bias and noise both derive from squaring the raw I<br />
and Q noise and equations for their distributions may<br />
be derived. The ideal correlation function is:<br />
Finally, the LOS error is modeled as:<br />
38 A Deep Integration Estimator for Urban Ground Navigation<br />
(8)<br />
(9)<br />
(10)<br />
where u is a unit vector from the IMU to the satellite,<br />
dba is the residual atmospheric delay error, and dtR is<br />
user clock residual error.<br />
The DI filter first uses the dz measurements to estimate<br />
the signal-to-noise ratio (SNR), allowing for smooth<br />
adaptation to jamming or low signal strength. Then, the<br />
DI filter performs an update of the filter error state. The<br />
details of this update algorithm are omitted here. Since<br />
the measurement model is highly nonlinear due to the<br />
form of R and its square, common Kalman methods<br />
must be replaced by algorithms from nonlinear estimation<br />
theory. Further discussion is in Ref. [4].<br />
The remaining arrow in Figure 2 shows the low to<br />
medium rate transfer of corrections. After all estimates<br />
are processed for one 10-Hz filter pass (all satellites,<br />
plus radar and altimeter measurements), the error state<br />
is used to calculate these corrections. At the end of the<br />
next 10-Hz interval, the navigation system incorporates<br />
these corrections in a reset. The following items<br />
are reset based on filter error states: position, velocity,<br />
quaternion, gyroscope, and accelerometer compensators,<br />
user clock error estimates, and LOS delay errors<br />
for satellites being tracked.<br />
The two-rate scheme of Figure 2 is critical to the operation<br />
of DI GPS. The data from the filter are not sent<br />
directly to the receiver. Rather, the corrections go to<br />
medium rate, and then indirectly affect NCO commands<br />
via the 10-Hz resets. The 50-Hz receiver control allows<br />
for tracking high-frequency dynamics in the correlators,<br />
while the lower rate filter execution allows for a<br />
more advanced estimation algorithm with more accurate<br />
estimates.<br />
Clock errors: Initialization and reacquisition<br />
Timing and clock errors are critical to deep<br />
integration.<br />
The previous section indicated how the navigation filter<br />
kept up accurate clock error estimates while tracking<br />
satellites in deep integration. Two closely related problems<br />
are clock initialization and clock recapture after<br />
satellite signal loss.<br />
Time is determined in navigation on the basis of highspeed<br />
interrupts from the Rockwell Collins receiver,<br />
referred to as t10 (10 ms apart) and t1000 (1 second<br />
apart). These are driven directly by the receiver<br />
oscillator.<br />
Navigation time, or user time, is based directly on<br />
a count of t10 interrupts. The user clock bias and<br />
frequency errors are defined in speed-of-light units as:<br />
dtR = user time – GPS time<br />
= user time frequency – true frequency<br />
For practical purposes, GPS time is considered perfect.<br />
True frequency is, in speed-of-light units, 1 + Doppler.<br />
As seen above, estimates of these enter into navigationissued<br />
NCO commands. From this follows the deep<br />
integration requirement: clock estimates must always<br />
be within about a chip (approximately 100 ft) of accuracy<br />
to retain code lock in deep integration.<br />
Initialization: At initial operation, the receiver is<br />
in control of its NCOs, and the navigation software<br />
receives t1000 interrupts and messages with the matching<br />
GPS times. The navigation wrapper software does<br />
careful bookkeeping of these data over at least three<br />
low-rate passes (t1000 interrupts). From this, a linear<br />
relationship between user and GPS time can be determined<br />
algebraically. The data are then passed to the<br />
navigation algorithm, which in turn (after navigation<br />
initialization), issues a command to the receiver to<br />
accept host control.<br />
Reacquisition: After a long period of time without visible<br />
GPS satellites, it was found that the receiver clock can<br />
drift nonlinearly to a point well outside the 100-ft accuracy<br />
requirement. An immediate return to DI updates<br />
would result in the loss of lock and poor performance<br />
of the PNS navigator.
An elementary solution based on a quick coarse clock<br />
recalibration was developed. The solution assumes that<br />
the time of GPS signal loss is sufficiently short so that<br />
the navigation position error has maintained relative<br />
accuracy (about 150 ft). This condition can be readily<br />
checked from filter variances. On return of signal power<br />
from one satellite, the navigation software calculates a<br />
candidate tcorr (see Eq.(2)), but instead of sending it<br />
to the receiver as an NCO command, it replaces the<br />
current clock error estimate with this value. Likewise, a<br />
difference in two tcorr calculations is assigned as clock<br />
frequency error. At the same time, filter variances are<br />
opened to indicate the coarseness of these estimates.<br />
At this point, the navigator again takes control of the<br />
NCOs, and subsequent filter passes allow for further<br />
refinement of clock and position errors.<br />
For the PNS tests conducted in 2005, the position errors<br />
were well under 150 ft, thus supporting the validity<br />
of the algorithm described above. <strong>Draper</strong> is currently<br />
investigating methods to extend the clock correction to<br />
relax the restriction on small position error.<br />
Doppler radar<br />
The Doppler radar sensors provide a three-dimensional<br />
velocity vector using short-range, low-power transceivers.<br />
The Doppler measurement is crucial to PNS<br />
in situations where GPS signals are unavailable, since<br />
it is the primary means (along with the altimeter) of<br />
damping position, velocity, and attitude drift inherent<br />
in the strapped-down navigation system. Tests<br />
have demonstrated that the Doppler allows for excellent<br />
performance indoors (with no GPS signals) for<br />
extended periods; furthermore, by keeping position<br />
errors bounded, it enables quick return to the GPS deep<br />
integration mode when satellite signals return.<br />
There are three Doppler sensors nominally in an<br />
orthogonal frame (designated dopp), with the sensing<br />
axes aligned so that in normal walking motion, each<br />
will reflect a signal off the floor or ground. <strong>Each</strong> sensor<br />
outputs 512 measured amplitudes from the reflected<br />
signal over 0.1 s, providing 2 cm/s Doppler resolution.<br />
The data are sent to the 10-Hz navigation function,<br />
which shifts the raw signal to baseband, performs a<br />
fast Fourier transform, then applies the Doppler law to<br />
derive LOS velocity. This velocity is shifted to the IMU<br />
center, giving a final processed Doppler measurement<br />
from the triad of:<br />
(11)<br />
This represents earth-relative velocity of the IMU center<br />
in the Doppler axis frame. The velocity is not instantaneous<br />
but an average over the 0.1-s interval of validity.<br />
The measurement is linearized for a Kalman update<br />
for the navigation error states. The filter observation is<br />
calculated as:<br />
(12)<br />
The bar over the navigation velocity indicates an average<br />
over the interval of validity.<br />
Finally, an error model for this measurement was<br />
derived by taking differentials. Showing only the most<br />
important terms, the resulting model is:<br />
(13)<br />
The error states in Eq. (13) are defined in Table 1.<br />
The Doppler error term consists of Doppler input axis<br />
misalignments (modeled by individual axis, not shown<br />
here) and discrete measurement noise.<br />
The fact that Equation 13 employs Doppler coordinates,<br />
rather than ecef, has major advantages. In these axes the<br />
three scalar measurements can be modeled with independent<br />
noise, and the three scalar updates can be done<br />
sequentially. This allows skipping or performing updates<br />
on a sensor-by-sensor basis, in response to sensor output<br />
validity indicators. The power level output by the Doppler<br />
sensors is used for this purpose. If one or two Dopplers<br />
measure very low power, this is taken to indicate invalid<br />
axes; for example, an axis may be pointing to a very<br />
distant reflector or to infinity. If all three axes read low<br />
power and other sanity checks are met, this indicates a<br />
stand-still event, and a zero velocity update is executed<br />
instead.<br />
Also note that the Doppler observation is a combination<br />
of velocity and attitude error, a consequence of the fact<br />
that it measures in a body-fixed frame, in contrast to<br />
GPS, which measures velocity in the earth-fixed frame.<br />
This can often create interesting results. For example, if<br />
GPS signals are strong and velocity is accurate, attitude<br />
can be improved by the Doppler. On the other hand,<br />
in a GPS-deprived scenario, attitude error can limit the<br />
improvement of navigation position accuracy.<br />
summary<br />
Results have shown that <strong>Draper</strong>’s configuration of deep<br />
integration GPS combined with other sensors is a practical<br />
design for a personal navigator. This paper has<br />
illustrated the main features of the algorithm design.<br />
A Deep Integration Estimator for Urban Ground Navigation 39
acknowledgment<br />
This material is based on work supported by the<br />
U.S. Army/Natick Soldier Center under Contract No.<br />
DAAD16-02-C-0040 C 2005, The Charles Stark <strong>Draper</strong><br />
<strong>Laboratory</strong>, Inc.<br />
references<br />
[1] Sherman, P., A. Kourepenis et al., “Personal Navigation for<br />
the Warfighter,” JNC’05.<br />
[2] Gustafson, D. and J. Dowdle, “Deeply Integrated Code Tracking:<br />
Comparative Performance Analysis,” 16 th International<br />
Technical Meeting of the Satellite Division of the Institute of<br />
Navigation, Portland OR, September 2003.<br />
[3] Kaplan, E.D., Understanding GPS: Principles and Applications,<br />
Artech House, 1996.<br />
[4] Gustafson, D., J. Dowdle, and K. Flueckiger, “A Deeply Integrated<br />
Adaptive GPS-Based Navigator with Extended-Range<br />
Code Tracking,” IEEE PLANS Conference, San Diego, March<br />
2000.<br />
40 A Deep Integration Estimator for Urban Ground Navigation
(l-r) Peter Sherman,<br />
Steven Holmes,<br />
Dale Landis and<br />
Tom Thorvaldsen<br />
bios<br />
Dale Landis is a Principal<br />
Member of Technical Staff<br />
at <strong>Draper</strong> <strong>Laboratory</strong>. His<br />
specialties include estimation<br />
theory, navigation algorithms,<br />
and applied mathematics.<br />
He has contributed software<br />
for munitions, satellites, and<br />
personal navigators. He received a <strong>Draper</strong> Distinguished Performance Award as a member of the team that first demonstrated<br />
the <strong>Draper</strong> deep integration algorithm on a GPS receiver; much of his recent work is aimed at the maturity and range of<br />
application of deep integration. Dr. Landis has a PhD in Mathematics from Lehigh University.<br />
Tom Thorvaldsen is a Distinguished Member of the Technical Staff and Group Leader for Navigation and Localization. He has<br />
been responsible for the design, architecture, and data analysis of numerous inertial navigation systems. He is on two patents<br />
and has received two Distinguished Performance Awards. He has been at <strong>Draper</strong> <strong>Laboratory</strong> since 1975 and holds a BS in<br />
Electrical Engineering from New Jersey Institute of Technology and an MA in Mathematics from the University of Michigan.<br />
Barry Fink is a Senior Member of Technical Staff at <strong>Draper</strong> <strong>Laboratory</strong>. He has been doing GPS work for 20 years. He has an<br />
MA in Mathematics from Boston University.<br />
Peter Sherman is a Principal Member Technical Staff, Special Operations and Tactical Systems, at <strong>Draper</strong> <strong>Laboratory</strong>. He was<br />
Technical Director of the successful Personal Navigation System project and continues as TD to the PNS follow-on. Prior to<br />
coming to <strong>Draper</strong>, he worked at Kearfott Guidance and Navigation developing a tactical-grade inertial multisensor – a singlechip<br />
gyro and accelerometer – using MEMS fabrication techniques. Also at Kearfott, he led software/system development and<br />
integration teams for ring-laser gyro (RLG)-based IMU and GPS/INS products. He was an Integrated Product Team (IPT) lead<br />
for the Joint Direct Attack Munition (JDAM) navigation subsystem on a Lockheed Martin-Kearfott team. Dr. Sherman is a<br />
member of IEEE, received a BS (Hon) from the University of Michigan and a PhD in Chemistry/Chemical Physics from the<br />
University of Oregon where he held an IBM Corp. Pre-doctoral Fellowship.<br />
Steven Holmes is a Senior Program Manager and currently leads <strong>Draper</strong> <strong>Laboratory</strong>’s efforts to become a CMMI Maturity<br />
Level III organization. In the recent past, he led <strong>Draper</strong>’s efforts to develop advanced ballistic and guided airdrop capabilities<br />
for the U.S. Army and Air Force, as well as efforts to develop a personal navigation system that provides accurate navigation<br />
information in a wide range of environments. He received a BS in Mathematics with a minor in Computer Science from<br />
Northeastern University (1987) and an MBA from Boston University (1994).<br />
A Deep Integration Estimator for Urban Ground Navigation 41
42<br />
Error Sources in In-Plane Silicon<br />
Tuning-Fork MEMS Gyroscopes<br />
Marc S. Weinberg, Anthony Kourepenis<br />
Copyright © 2006 IEEE. Published in Journal of Microelectromechanical Systems, Vol. 15, No. 3, June 2006<br />
abstract<br />
This paper analyzes the error sources defining tacticalgrade<br />
performance in silicon, in-plane tuning-fork gyroscopes<br />
such as the Honeywell-<strong>Draper</strong> units being delivered<br />
for military applications. These analyses have not yet<br />
appeared in the literature. These units incorporate crystalline<br />
silicon anodically bonded to a glass substrate. After<br />
general descriptions of the tuning-fork gyroscope, ordering<br />
modal frequencies, fundamental dynamics, force and<br />
fluid coupling, which dictate the need for vacuum packaging,<br />
mechanical quadrature, and electrical coupling are<br />
analyzed. Alternative strategies for handling these engineering<br />
issues are discussed by introducing the Systron<br />
Donner/BEI quartz rate sensor, a successful commercial<br />
product, and the Analog Device (ADXRS), which is<br />
designed for automotive applications.<br />
Introduction<br />
The development of microelectromechanical systems<br />
(MEMS) inertial sensors offers revolutionary improvements<br />
in cost, size, and ruggedness relative to fiber-optic and<br />
spinning mass technologies. [1],[2] Driven by high-volume<br />
commercial market needs, applications continue to grow<br />
for modest performing components at prices below $10/<br />
axis. The Army is funding a $100M initiative to realize<br />
producible, low-cost, tactical-grade MEMS inertial measurement<br />
units (IMUs) for gun-launched munitions and missile<br />
applications. The continued maturation of the technology<br />
will enable new applications and markets to be realized.<br />
This paper analyzes design considerations necessary to<br />
reach tactical-grade performance in a silicon MEMS tuningfork<br />
gyroscope (TFG) such as the <strong>Draper</strong>-based design that<br />
Honeywell is delivering in military systems. In the appendices,<br />
alternative strategies for handling these engineering<br />
issues are discussed by introducing the Systron Donner/
BEI quartz rate sensor, a successful commercial product,<br />
and the Analog Device (ADXRS), which is designed for<br />
automotive applications.<br />
While many universities, government organizations, and<br />
companies have done research or even advertised the availability<br />
of inertial sensors, only a handful produces inertial<br />
instruments on a commercial scale. University of California,<br />
Berkeley, [3]-[5] University of Sheffield, UK, [6] University<br />
of Newcastle, UK, [7] Seoul University, Korea, U. Neuchatel,<br />
Switzerland, [8] the Massachusetts Institute of Technology<br />
(MIT), Tohoku University, Japan, [9] Sandia, [10] Integrated<br />
Micro Instruments, [10] Cal Tech, Jet Propulsion Lab, [11]<br />
University of California, Los Angeles (UCLA), [11] National<br />
University of Singapore, [12] University of Michigan, [13],[14]<br />
Sagem, [15] and many others have published on MEMS<br />
gyros. Three hundred sixty eight MEMS fabrication facilities<br />
have been identified worldwide. [16]<br />
The MEMS angular rate sensor or gyroscope divides itself<br />
into tactical and automotive/commercial performance<br />
categories. Two companies are producing tactical-grade<br />
performance on the order of 1 to 10 deg/h. Several are<br />
producing automotive grade, which is loosely defined as<br />
several hundred to a few thousand deg/h. The scarcity of<br />
commercial sources despite the plethora of research efforts<br />
and advertisements underscores the difficulty in constructing<br />
MEMS angular rate sensors.<br />
Based on technology developed at <strong>Draper</strong> <strong>Laboratory</strong>,<br />
Honeywell is delivering HG1900, HG1920, and HG1930<br />
navigation systems. After a decade of excellent test data,<br />
production quantities are now being realized. In 2004,<br />
several hundred systems were delivered for military applications,<br />
such as artillery shell and mortar shell guidance.<br />
Discussed further in the next section, this gyro is crystalline<br />
silicon-on-glass and has two mechanically-coupled<br />
proof masses moving in antiparallel directions, and senses<br />
rate in the wafer substrate plane.<br />
Systron Donner/BEI has built hundreds of thousands of<br />
quartz TFGs over the past 15 years. [17],[18] For their higher<br />
performance units, quoted specification sheet performance<br />
is 36 deg/h/ noise, and uncompensated thermal sensitivities<br />
are 21 deg/h/°C and 300 ppm/°C. These sensors<br />
have been used in many higher performance automobiles<br />
for traction and stability control and in military systems.<br />
Automotive or commercial-grade angular rate sensors<br />
perform at several hundred to a few thousand deg/h.<br />
Analog Devices’ ADXRS150 specifies noise of 180 deg/h/<br />
and uncompensated thermal sensitivities of 1440 deg/h/°C<br />
and 1700 ppm/°C (typical values are 180 deg/h/°C and 150<br />
ppm/°C). Analog employs polysilicon deposited over oxide<br />
sacrificial layers. Because of integrated on-chip electronics,<br />
these gyros are small and consume only 30 mW per axis.<br />
Silicon Sensing Systems, a collaboration of BAE Systems<br />
and Sumitomo, sells an automotive gyro consisting of a<br />
MEMS ring resonator driven by magnetic fields. Delphi<br />
pursued ring resonators for several years, but no information<br />
has been released in recent years. In their automotive<br />
products, Bosch has incorporated a rate sensor that<br />
can be purchased as a replacement part at BMW dealers.<br />
The sensor consists of two linear accelerometers supported<br />
in a vibrating frame. [19] Bosch employs a 10-µm polysilicon<br />
process [20] that results in gorgeous parts with straight<br />
smooth sidewalls.<br />
For several dollars, Murata sells a vibrating beam gyroscope<br />
with a piezoelectric readout. Since stability is poor,<br />
high-pass filtering is recommended. This gyro has been<br />
applied to vibration control problems such as camera and<br />
camcorder stabilization. O-Navi (formerly Gyration) is<br />
selling sample quantities. [21] Crossbow Technology and<br />
Cloud Cap Technology, Hood River, Oregon, deliver sixaxis<br />
systems based on Analog Devices’ inertial sensors.<br />
Other gyro manufacturers include L-3, Panasonic, and<br />
Samsung. [22],[23] Although mentioned on their web sites,<br />
little is known about these angular rate sensors. Imego,<br />
Sweden, [24] produces small numbers of sensors. Kionix, [25]<br />
Ithaca, NY, and Microsensors, a subsidiary of Irvine<br />
Sensors, advertise automotive-grade MEMS gyroscopes.<br />
SensoNor will ship their SAR10 automotive-grade angular<br />
rate sensor on short notice. [26]<br />
This paper’s unique contributions include: 1) analysis<br />
and tolerances required to realize antiparallel tuningfork<br />
motion; 2) two-degree-of-freedom model of instrument<br />
dynamics, including fluid and mechanical cross-axis<br />
couplings; 3) force and fluid coupling models, which<br />
dictate evacuated packages for better performance units;<br />
and 4) mechanical quadrature models that have led to laser<br />
trimming.<br />
When discussing performance, most published work on<br />
MEMS angular rate sensors focused on z-axis gyros, which<br />
sense rate perpendicular to the substrate, and emphasized<br />
wide bandwidth resolution. For z-axis gyros, nonideal<br />
suspension geometries were studied in References [27] and<br />
[28]. More recently, the University of California, Irvine, has<br />
considered z-axis gyro scale-factor variation with frequency<br />
and temperature. [29],[30]<br />
Description of Honeywell/<strong>Draper</strong> tFG<br />
The <strong>Draper</strong>/Honeywell TFG is shown in Figure 1. This<br />
sensor was designed to achieve the highest performance<br />
consistent with costs that are low compared with<br />
traditional mechanical sensors. The gyro consists of<br />
two perforated proof masses supported by a system of<br />
suspension elements. The suspension and proof masses<br />
are doped crystalline silicon anodically bonded to a<br />
Pyrex or glass substrate at the suspension beam anchors<br />
and at the comb structures. [31],[32] Curling from etch<br />
stop doping gradients is avoided by annealing silicon<br />
diffused with boron or by employing uniformly grown<br />
silicon-on-insulator. The glass substrate precludes onchip<br />
electronics; however, the high resistivity reduces<br />
Error Sources in In-Plane Silicon Tuning-Fork MEMS Gyroscopes 43
stray capacitance, which mitigates the need for on-chip<br />
circuitry. (With silicon wafers, bond pads are isolated from<br />
the conducting substrates by thin dielectric layers so that<br />
high stray capacitance limits performance. With on-chip<br />
circuits, bond pads and stray capacitance are avoided.)<br />
Sense<br />
Plate<br />
Torsion<br />
Beam<br />
Sense<br />
Electrode<br />
Base Beam Anchor<br />
(a)<br />
SPO SPO<br />
Drive<br />
Beam<br />
Proof<br />
Mass<br />
Anchor Base Beam<br />
LM LS MPO<br />
RS RM<br />
Figure 1. The <strong>Draper</strong>/Honeywell TFG mechanism. In 1(b)<br />
and 1(c), silver is metal, diagonal lines indicate<br />
silicon attached to glass, and white indicates<br />
suspended silicon. Electrical contact pads are<br />
right motor drive (RM), right sense electrode<br />
(RS), motor pickoff (MPO), left sense electrode<br />
(LS), left motor drive (LM), and sense pick off<br />
(SPO).<br />
On either side of each proof mass are interdigitated<br />
combs. [33] The outer combs (left and right motor in Figure<br />
1) are used for electrostatically driving the proof masses<br />
antiparallel to the substrate in the x direction. The inner<br />
combs (motor pickoff in Figure 1) sense the drive motion<br />
and are typically biased to 5 Vdc through an op amp that<br />
senses charge traversing the comb gap. As described in “The<br />
Fundamental Dynamics of Oscillating Coriolis Sensors”<br />
44 Error Sources in In-Plane Silicon Tuning-Fork MEMS Gyroscopes<br />
(b)<br />
Motor Pick Off<br />
Substrate<br />
W I Input Rate<br />
(c)<br />
y<br />
x<br />
Mass Motor<br />
Sense Electrode<br />
Proof<br />
Mass<br />
section, rotation about the in-plane z-axis induces Coriolis<br />
acceleration, which deflects the proof masses in opposite<br />
directions perpendicular to the substrate. Beneath the<br />
plates are deposited metal electrodes that are excited with<br />
dc voltages of opposite polarities. The right sense plate (RS<br />
in Figure 1) is typically excited with 5 V and the left sense<br />
plate (LS) with -5 V. Differential proof mass motion induces<br />
electrical currents in the structure that flow through the<br />
suspensions and sense pickoff (SPO, Figure 1) into a<br />
preamplifier whose input contains the input angular rate<br />
modulated by the drive frequency.<br />
With drive resonant frequencies from 10 to 20 kHz, these<br />
gyroscopes are relatively stiff with suspension stiffnesses<br />
greater than 100 N/m. With 3-µm gaps, mechanical spring<br />
force of 300 µN is available to overcome sticking; nevertheless,<br />
care in etching and release, in electronic excitation,<br />
and mechanical handling is required.<br />
As detailed below, the challenge is to obtain excellent<br />
performance in a device where the sensitivity to angular<br />
rate is small. Obstacles include manufacturing tolerances<br />
and the relatively large magnitudes of non-Coriolis forces<br />
and electrical drive and excitation signals.<br />
Mode Ordering<br />
A first challenge is designing the angular rate sensor’s<br />
dynamic eigenfrequencies. If one considers the TFG proof<br />
masses (Figure 1) rigid and the suspension beams without<br />
mass, 3 rotations and 3 translations times 2 masses imply at<br />
least 12 dynamic modes. For advanced designs, proof mass<br />
compliance and suspension modes add further considerations.<br />
The TFG is designed so that the lowest frequency<br />
modes are generally: 1) drive or tuning fork, 2) translation,<br />
3) sense, and 4) out-of-plane. In the tuning-fork mode, the<br />
proof masses move antiparallel to the substrate. One usually<br />
attempts to excite this mode through the electrostatic motor<br />
drive. Similar proof mass amplitudes are the design goal.<br />
The drive frequency is designed for 10-20 kHz to reduce<br />
vibration and acoustic effects. For the translation mode,<br />
the proof masses move parallel to the substrate. Because<br />
the drive combs are controlled to apply forces in opposite<br />
directions, translation should not be excited by electrostatic<br />
drive; however, translation is excited by linear acceleration.<br />
To ensure tuning-fork operation despite beam width tolerances,<br />
the in-plane translation frequency is usually set 10-<br />
15% or more away from the drive frequency.<br />
The sense mode has the two proof masses moving away<br />
or toward the substrate in opposite directions. This could<br />
also be a rotation about their common center. For good<br />
gain, the sense eigenfrequency is set 5-15% away from the<br />
drive. While higher gain can be achieved at smaller separation,<br />
small variations in the resonant frequencies result in<br />
larger fractional changes of scale factor. When the out-ofplane<br />
mode is excited, the two proof masses move together<br />
perpendicular to the substrate. It is important that the lowest<br />
modes do not fall close to one another and that higher order<br />
modes are not integral multiples of the basic four.
Obtaining ±2% sense-drive frequency separation tolerance<br />
is challenging. The mechanical design is done using<br />
modal analysis in finite-element calculations. The tolerance<br />
required is estimated by noting that the beam mass<br />
is small compared with that of the proof mass. As a first<br />
approximation, stiffness is determined by beam bending<br />
(more detailed analyses include torsion elements) so that<br />
the sense resonant frequency depends on the beam thickness<br />
as w1/2t3/2, while the drive resonance depends on the<br />
beam width as t1/2w3/2 . For a fixed thickness, the frequency<br />
separation is proportional to the beam widths. With greater<br />
detail, the frequency separation is still strongly determined<br />
by tolerances on the beam width and thickness. In the<br />
dissolved wafer process [31] used for the <strong>Draper</strong>/Honeywell<br />
TFGs, the beam width and thickness are determined in<br />
independent steps. The thickness is determined by boron<br />
diffusion or by purchased silicon-on-insulator wafers. The<br />
beam widths are set by masks and deep reactive ion etching.<br />
Typical beam widths are 10 µm. Achieving 2% accuracy in<br />
frequency separation requires 0.2-µm absolute accuracy of<br />
the beam widths. This accuracy challenges the tolerances<br />
on masks and requires great control of deep etching.<br />
Consider separation of the in-plane translation and drive<br />
or tuning-fork mode where the proof masses translate<br />
in parallel but opposite directions. Tuning-fork motion<br />
is desired to common mode reject in-plane linear accelerations<br />
and to reduce damping forces. With tuning-fork<br />
operation, the proof masses move in opposite directions so<br />
that the base beam (Figure 1) remains essentially stationary,<br />
and only small shear stresses are transmitted through<br />
the anchors to the substrate. With no anchors bending,<br />
energy is not transmitted or radiated to the substrate so<br />
that a high mechanical quality factor, a precursor to low<br />
force coupling (see next section), is attained. The tuningfork<br />
eigenfrequency depends only on the suspension beams<br />
from the proof mass to the base beam (Figure 1). With<br />
only a single proof mass, acceleration near drive frequency<br />
would alter the proof mass velocity and appear directly as<br />
a scale-factor error in (4). For order of magnitude common<br />
mode rejection, the driven amplitudes of the two proof<br />
masses should match to 10%; that is, the common mode<br />
motion or translation mode should be 5% of the individual<br />
proof mass motion.<br />
A lumped parameter, two-mass three-spring model for<br />
drive-translation motion is shown in Figure 2. Derived in<br />
Appendix A, the translation is related to the tuning fork or<br />
differential motion by:<br />
where<br />
k = nominal stiffness of beam from proof mass to base<br />
beam<br />
Dk = stiffness deviation from nominal (k1 = k + Dk/2,<br />
(1)<br />
k 2 = k - Dk/2)<br />
Dx = differential proof mass motion (x 1 – x 2 )<br />
Sx = translation motion (x 1 + x 2 )<br />
w H = eigenfrequency of hula (in-plane translation)<br />
mode<br />
DF = F 1 – F 2 = differential force (excites tuning-fork<br />
mode)<br />
s = Laplace transform of d /dt = jw D<br />
F 2<br />
Figure 2. Lumped parameter model of in-plane dynamics.<br />
Where the tuning-fork beams (from proof mass to base<br />
beam) largely determine the drive resonance, the translation<br />
mode also depends on the anchor beams (from<br />
anchors to base beam). Smaller differential stiffness and<br />
larger drive-translation frequency separation excites translation<br />
less. The stiffness depends on beam width cubed.<br />
Assume that the beam widths differ by 1% for the right<br />
and left proof masses, the differential stiffness is 3%. With<br />
the translation frequency 90% of the drive frequency, the<br />
translation motion is 6.4% of the tuning-fork motion. The<br />
beams must match to 0.1 µm (see earlier portion of this<br />
section). Achieving good separation often requires that the<br />
anchor beams be thinner than the tuning-fork beams. If the<br />
anchor beams are thick and rigid, the base beam is attached<br />
to the substrate and the proof masses move independently;<br />
that is, the drive and translation modes are identical. These<br />
thin beams present challenges and often approach the limits<br />
of micromachining capability.<br />
Fundamental Dynamics of Oscillating Coriolis sensors<br />
To understand TFG performance, consider a model that<br />
includes only the sense and drive modes. As shown in the<br />
previous section, the drive motion can often be considered<br />
separate from the translation (hula) modes. With only<br />
linear terms considered, the drive and sense axis dynamics<br />
are described by second-order spring-mass systems with<br />
coupling between modes:<br />
Drive<br />
Sense<br />
m 2<br />
Proof<br />
Mass<br />
x 2 x b x 1<br />
b 2<br />
k 2<br />
k b<br />
b b<br />
m b<br />
Base Beam<br />
Proof<br />
Mass<br />
where<br />
m = mass of one proof<br />
d,s = subscripts that indicate drive and sense axes,<br />
respectively.<br />
k 1<br />
b 1<br />
Error Sources in In-Plane Silicon Tuning-Fork MEMS Gyroscopes 45<br />
m 1<br />
F 1<br />
(2)<br />
(3)
= damping<br />
k = stiffness. Mostly mechanical with modifications<br />
by electrostatic forces<br />
kds = quadrature coupling. The drive axis suspension<br />
force coupling into the sense axes<br />
bds = in-phase damping ‘surfboard’ coupling to sense<br />
axis<br />
x = motion along drive axis (parallel to substrate)<br />
y = motion along sense axis (normal to substrate)<br />
s = Laplace transform of d /dt<br />
Fd = motor drive force applied by the outer combs in<br />
Figure 1<br />
WI = slowly varying input rate<br />
a = drive force coupling to sense axis<br />
Q = quality factor<br />
From (2) and (3), another challenge emerges. The driving<br />
force as well as the drive axis suspension force and drive<br />
axis damping are coupled into the sense axis. With good<br />
design, these forces should be small compared with the<br />
Coriolis Force .<br />
For low-frequency angular rate inputs, the desired output<br />
is the angular rate modulated by the drive frequency. As<br />
shown in the electrical circuit of Figure 3, the proof masses<br />
are the negative input of a high input impedance, highgain<br />
operational amplifier whose input node is at virtual<br />
ground. The feedback resistor is large so that it does not<br />
affect the output at the gyro’s drive frequencies. From (3)<br />
and Figure 3, the preamplifier output is given by (Appendix<br />
B):<br />
where<br />
Vo = output of preamplifier<br />
Vs = bias voltage (plus and minus applied to right and<br />
left sense plates in Figure 1) on sense electrodes<br />
(5 V, example values are given in parentheses)<br />
Vc = coupling (drive feedthrough)<br />
VN = preamplifier input voltage noise (10-8 V/ )<br />
46 Error Sources in In-Plane Silicon Tuning-Fork MEMS Gyroscopes<br />
(4)<br />
Cfb = feedback capacitor about the sense axis preamplifier<br />
(2 pF)<br />
Cs = total of sense capacitors (2 pF)<br />
CN = preamplifier input capacitance to ground (5<br />
pF)<br />
Cc = coupling (undesirable capacitor) to virtual<br />
ground (preamplifier input)<br />
dCs /dy = differential change of sense capacitors with y<br />
motion (2 pF/3 µm)<br />
SC = sum of all capacitors attached to the virtual<br />
ground. Includes strays, working, feedback,<br />
and amplifier capacitors (12 pF).<br />
wd = drive mode undamped natural frequency<br />
(20 kHz x 2 prad/s)<br />
w s = sense mode undamped natural frequency<br />
(22 kHz x 2 prad/s)<br />
x o = amplitude of drive motion (10 µm zero-to-peak)<br />
Fs = cross coupling forces acting along the sense<br />
direction (B-6)<br />
q = phase shift through sense dynamics (B-6)<br />
Proof<br />
Mass<br />
C c Cs/2 C s /2<br />
V c -V s V s<br />
C N<br />
Figure 3. Circuit diagram for sense preamplifier analysis.<br />
In (4), it is assumed that the proof mass motion is driven<br />
so that the displacement is a sinusoidal function of time.<br />
The rate signal, the Coriolis term, is in phase with the<br />
proof mass velocity, i.e., in quadrature with the proof mass<br />
position. For the sample parameters above, the gyro scale<br />
factor at the preamplifier output is 1.3 mV/rad/s. With a<br />
field effect transistor (FET) preamplifier whose input noise<br />
at drive frequency is 10 nV/ , the rate equivalent noise<br />
is 10 deg/h/ . Attaining the theoretical noise limit is a<br />
challenge discussed further in the “Electrical Coupling”<br />
section.<br />
Because of the sense-drive frequency separation and high<br />
sense-axis quality factor, the damping term is omitted in<br />
the denominator of (4); therefore, gain does not depend<br />
on damping. High resonant frequencies are desired to<br />
remove the gyro’s sensitive frequencies from acoustic<br />
noise and vibration and to permit isolators that allow<br />
adequate bandwidth. For a fixed sense-plate bias, higher<br />
sensitivity is achieved by lowering the resonant frequencies<br />
and/or by decreasing the separation between sense<br />
and drive mode. Drive frequencies of 10-25 kHz and<br />
sense-drive mode separations of 5-15% have worked well<br />
for MEMS TFGs. At baseband, the transfer function of<br />
output voltage to rate input has a lightly damped peak<br />
at the frequency separation. Placing the separation at 1-2<br />
kHz allows a 100-Hz bandwidth, which adequately filters<br />
R fb<br />
V N<br />
C fb<br />
–<br />
+<br />
V R<br />
V o<br />
Output<br />
Voltage
the undamped peak. If the frequency separation is small,<br />
the scale factor becomes sensitive to small variations in<br />
resonant frequencies (4).<br />
Demodulation (Figure 4) multiplies the output (4) by<br />
sin(wdt+j), a signal in-phase with the drive velocity.<br />
The output after demodulation and low-pass filtering is<br />
(Appendix B):<br />
(5)<br />
where<br />
Gac = gain before the demodulator<br />
VB = bias voltage in dc section often caused by amplifier<br />
offset voltages.<br />
dem = demodulation operation. Frequencies near the<br />
demodulation frequency are transferred to baseband<br />
by the sin(wdt+j) demodulation<br />
j = small phase shift between rate signal in sense<br />
chain and demod reference<br />
Drive<br />
Force<br />
Drive Axis<br />
Dynamics<br />
Self-Drive Oscillator Loop<br />
Velocity Velocity<br />
Signal<br />
2mWI Output<br />
Noise<br />
Other<br />
Forces<br />
S<br />
Sense Axis<br />
Dynamics S<br />
Electrical<br />
Comp.<br />
ac<br />
Gain<br />
Sense Axis Chain<br />
Figure 4. TFG electrical block diagram.<br />
In (5), small angle approximations for the angles q and<br />
j were applied. The ac gain, typically 5-20 V/V, and the<br />
low-pass filtering blocks are shown in Figure 4. This low<br />
pass filter, typically 50-100 Hz, sets the gyro’s bandwidth.<br />
Feedthrough terms (5) are extremely important. The<br />
demodulation function dem emphasizes that extra voltages<br />
in phase with drive velocity appear directly as dc bias errors<br />
in the TFG. Components in quadrature to drive velocity<br />
are greatly reduced at the dc output; however, mechanical<br />
and electric phase shift error causes quadrature terms<br />
to appear as in-phase bias. Individual challenges and their<br />
implications on gyro construction are discussed in the next<br />
section.<br />
X<br />
Filter and<br />
dc Gain<br />
Indicated<br />
Rate<br />
error Mechanisms<br />
Force-Related Errors – The Impetus for Evacuation<br />
Vacuum packaging is needed to reduce the required motor<br />
force and the voltage required to drive the motor. From (3),<br />
the motor force couples into the sense axis. For reasonable<br />
scale factor, large drive amplitude is desired so that the<br />
drive axis is operated at resonance; that is, the motor force<br />
is in phase with the drive velocity. When the interdigitated<br />
combs are over a ground plane, lift forces are exerted. [33]<br />
Derived in Appendix C, the erroneous estimated angular<br />
rate can be calculated from:<br />
For a single set of combs, the coupling coefficient a is<br />
of the order of 0.3. [33] Because the left and right motors<br />
behave similarly, this is common mode coupling. Since<br />
both outer combs cause lift and since the sense plate excitation<br />
is selected to detect differential motion, the differential<br />
coupling determines the gyro bias. The coupling<br />
coefficient depends strongly on vertical misalignment (the<br />
disengagement) of the moving and stationary combs. [33]<br />
With a 20-kHz drive frequency and 100,000 quality factor,<br />
the erroneous common mode angular rate is 0.2 rad/s. The<br />
differential magnitude is typically an order of magnitude<br />
smaller. Because damping changes by a factor of three over<br />
operating temperature, thermal compensation is usually<br />
employed; nevertheless, the absolute tolerances and stability<br />
of the comb disengagements must be held very closely<br />
to achieve tactical performance.<br />
In addition to the electrostatic force coupling, hydrodynamics<br />
couple drive force into sense force. Described by<br />
lubrication theory, the fluid coupling is described in detail<br />
with closed-form solutions in Reference [34]. Once the<br />
coupling coefficient is calculated, (6) can be used to estimate<br />
the impact on estimated angular rate. Evacuation<br />
and pressure relief holes are required for acceptably low<br />
effects on in-phase bias. Perforated designs such as Figure<br />
1 result in hydrodynamic lift that is smaller than the electrostatic<br />
coupling. The perforations also assist cleaning and<br />
inspection.<br />
The random motion of the proof mass is dictated by Brownian<br />
motion. To achieve preamplifier limited performance,<br />
gas damping must be reduced by evacuation so that the<br />
principal damping is material and radiation through the<br />
anchors into the glass.<br />
Even if a vacuum is not required (as in an accelerometer),<br />
the small gaps and masses dictate hermetic sealing since<br />
humidity variation causes unacceptable variations in scale<br />
factor because of effective gap change. As temperature<br />
changes even with hermetic sealing, outgassing deposits<br />
material and changes the sense and motor gaps so that the<br />
scale factor is changed.<br />
To summarize, evacuation is required in high-performance<br />
gyros for the following reasons: 1) reduce the electrostatic<br />
Error Sources in In-Plane Silicon Tuning-Fork MEMS Gyroscopes 47<br />
(6)
drive force and, hence, coupling into sense axis force; 2)<br />
reduce hydrodynamic lift (surfboarding) effects; 3) maintain<br />
acceptable phase stability between sense and drive axes<br />
(the omitted damping in the denominators of (4) and (5));<br />
4) render Brownian motion small so that wide bandwidth<br />
resolution is achieved; and 5) enhance resolution since low<br />
damping does not restrict sense-axis motion in (4) and (5).<br />
Low damping increases proof mass motion if shocks are<br />
applied. These effects are reduced by the two-mass design,<br />
which rejects common mode inputs, and modal frequency<br />
selection. The high resonant frequencies are above most<br />
shock spectra, which are often defined to a few kilohertz.<br />
With high resonant frequencies, shocks and acoustic<br />
inputs are reduced by suspension isolating the IMU. The<br />
sense axis baseband peak, which occurs at the drive-sense<br />
separation, typically 10 kHz, is greatly reduced by sense<br />
chain low-pass filtering.<br />
Mechanical Quadrature<br />
The drive axis is operated at resonance so that the stiffness<br />
and inertial forces in (2) cancel and the drive-axis response<br />
is dominated by damping; nevertheless, a relatively large<br />
spring force is being exerted. Because of manufacturing<br />
imperfections or tolerances, the mechanical stiffness force<br />
results in the cross-coupling term kds. A slender beam tries<br />
to bend along its principal axes of inertia. [35] If the principal<br />
inertias are not aligned with the drive and sense axes,<br />
an attempt to bend the beams in the x direction results in<br />
a y force. Consider the cross section of a simple suspension<br />
beam where the sidewalls are not cut vertical but at<br />
an angle q to form a parallelogram cross section as shown<br />
in Figure 5. For small sidewall angles q, the ratio of crosscoupling<br />
to in-plane force is given by: [36]<br />
where<br />
t = thickness of suspension beams and proof mass as<br />
defined in Figure 5<br />
w = nominal beam width as defined in Figure 5<br />
q = tilt of sidewalls<br />
t<br />
Y Axis (Substrate Frame)<br />
w a<br />
48 Error Sources in In-Plane Silicon Tuning-Fork MEMS Gyroscopes<br />
(7)<br />
Figure 5. Nomenclature for analyzing quadrature from<br />
beam sidewall angle.<br />
q<br />
X Axis<br />
Because the suspension consists of several beams rather<br />
than a simple cantilever, the mechanical quadrature is 3-<br />
10 times smaller than that calculated by (7). Equating the<br />
Coriolis term to the cross-coupled term as in Appendix C,<br />
the estimated input rate error from cross coupling is given<br />
by:<br />
Because the coupling is in-phase with drive position, the<br />
cross-coupled force term is in quadrature with the desired<br />
rate signal. With good demodulation (see “Mode Ordering”),<br />
little quadrature should appear in the indicated<br />
rate output. In a typical TFG, t/w = 2. Because of the two<br />
proof masses, the differential coupling between right and<br />
left masses is the principal concern. With sidewall slopes<br />
matched to 0.002 r (0.1 deg), a tight tolerance for vertical<br />
deep etching in silicon, the coupling ratio aQ is 0.008<br />
and the magnitude of the quadrature signal (8) is 502 rad/<br />
s (108 deg/h). For tactical performance, the sheer magnitude<br />
of the possible quadrature signal presents major design<br />
challenges. In addition to dynamic range, small variations<br />
in demodulator phase lead to unacceptable bias shifts.<br />
The TFG handles quadrature by very careful micromachining<br />
and by applying a quad nulling loop [37] to reduce<br />
the quadrature signal injected into the sense channel. As<br />
shown in Figure 4, the sense axis output is demodulated<br />
into components in-phase and in quadrature with the<br />
desired input rate-drive velocity signal. The sense chain<br />
quadrature signal is nulled by applying a dc voltage bias to<br />
the drive combs in addition to the two frequencies motor<br />
drive. Because of limited available voltage, mechanical<br />
quadrature must be less than 50 rad/s for successful quad<br />
nulling. Because of the nulling loop, the sense chain does<br />
not require head room for the large mechanical quadrature.<br />
High-performance or as-etched quadrature larger<br />
than 50 rad/s requires mechanical trimming, a procedure<br />
described in Reference [36]. The difficulty of quadrature is<br />
that small imperfections lead to large quadrature; however,<br />
only small amounts of material must be removed for effective<br />
trimming.<br />
Electrical Coupling<br />
The drive voltages are typically 5 V. From (4) or (5), 100<br />
fF (Cc = 10-13 F) stray capacitance to the sense node results<br />
in an output voltage of 250 mV, equivalent to 200 rad/s<br />
(4 x 10⁷ deg/h). Small coupling capacitance can lead to a<br />
sense change signal much larger than the desired angular<br />
rate resolution and to dynamic range issues. This coupling<br />
effect is mitigated by two-frequency operation and balanced<br />
drive. The coupling can occur at the combs or in the leads<br />
leading to the package or even in the electronics itself.<br />
For an electrostatic drive, the force is proportional to the<br />
voltage squared; thus, the drive force could be at the difference<br />
frequency between two input voltages. [37] Because<br />
the two frequencies can differ from the drive frequency<br />
(8)
at which demodulation is done, coupling effects from the<br />
motor to the sense are greatly reduced (5). Because the half<br />
frequencies are generally derived from the motor position<br />
signal, the motor drive must be designed carefully to make<br />
motor frequency signals small.<br />
Voltage squaring allows the motor to be driven with plus<br />
and minus voltages, which reduce the coupling into the<br />
sense chain. Because of amplitude mismatch (see “Mode<br />
Ordering”), the voltages must cancel for each proof mass so<br />
that layout and connections become more complicated. A<br />
bias is added to the motor drives to null mechanical quadrature<br />
signals and charge injected by the motor pickoff.<br />
For proper operation, the motor drives must also be<br />
isolated from the motor sense so that the drive oscillator<br />
loop locks onto the mechanical motion and not onto the<br />
half frequency signals. Considerations of dynamic range,<br />
motor loop oscillator, and stability dictate that capacitance<br />
be matched to 10 fF, a significant design and manufacturing<br />
challenge. This figure is supported by simulation and<br />
results of production units.<br />
Conclusion<br />
For TFGs, the phenomena that cause the principal errors in<br />
estimating angular rate were evaluated. To realize a working<br />
MEMS gyroscope, many design features must be done<br />
correctly. Design teams must converge quickly to a feasible<br />
solution or have sufficient resources to afford several iterations.<br />
The challenges overcome in realizing a high-performance<br />
MEMS gyro included: 1) geometric tolerances,<br />
2) attaining theoretical noise limits, 3) vacuum packaging,<br />
4) reduction of mechanical quadrature, 5) eigenfrequency<br />
location, 6) electrical coupling, and 7) thermal<br />
expansion effects. Precise suspension beam dimensions<br />
were required to maintain the desired ordering of modes<br />
and frequency separation to achieve beam symmetry for<br />
reasonable quadrature and to maintain comb disengagement,<br />
which causes vertical forces. Achieving acceptable<br />
quadrature required mechanical trimming and electrical<br />
feedback. Reaching theoretical noise limits required careful,<br />
symmetric layout of electrical leads, of electronics, and<br />
of the sensor itself to avoid coupling through unbalanced<br />
stray capacitance. Thermal expansion changes dimensions<br />
that change gyro performance; for example, comb engagement<br />
alters sense axis force, and, hence, instrument bias,<br />
and sense gap alters scale factor. Alternatives for overcoming<br />
the above challenges are presented by introducing the<br />
Analog Devices and BEI angular rate sensors.<br />
<strong>Draper</strong> used the considerations and analyses presented<br />
here in developing the TFG technology Honeywell has<br />
applied to its navigation systems. After a decade of excellent<br />
test data, production quantities are now being realized.<br />
In 2004, several hundred systems were delivered for<br />
mainly military applications, such as artillery shell and<br />
mortar shell guidance. Gyro noise is 5-10 deg/h/ with<br />
bias and scale factor repeatability over temperature and<br />
turn off better than 30 deg/h and 400 ppm, respectively.<br />
Raw, uncompensated thermal sensitivities are 10 deg/h/°C<br />
and 250 ppm/°C.<br />
appendix a. Derivation of translation Mode from<br />
Differential Force<br />
The relation for translation mode versus differential mode<br />
(1) is derived. From Figure 2, consider only motion parallel<br />
to the substrate. Neglect damping and apply Newton’s<br />
law to proof masses 1 and 2 and to the base beam:<br />
F1 = m1s2x1 + k1 (x1 – xb ) (A-1)<br />
F2 = m2s2x2 + k2 (x2 – xb ) (A-2)<br />
0 = (mbs2 + kb )xb – k1 (x1 – xb ) – k2 (x2 – xb ) (A-3)<br />
where<br />
k = stiffness of extension spring<br />
m = mass<br />
x = displacement of mass<br />
1,2,b = subscripts indicating proof mass 1, proof mass 2,<br />
or base beam<br />
s = Laplace transform of d /dt = jwD Add (A-1) and (A-2) to obtain the translation equation:<br />
(A-4)<br />
where<br />
Dk = stiffness deviation from nominal (k1 = k + Dk/2,<br />
k2 = k - Dk/2)<br />
Dm = mass deviation from nominal (m1 = m + Dm/2,<br />
m2 = m - Dm/2)<br />
Dx = differential proof mass motion (x1 – x2 )<br />
Sx = sum of translation motion (x1 + x2 )<br />
DF = F1 – F2 = differential force (excites tuning-form<br />
mode) usually applied by electrostatic comb<br />
drive<br />
SF = F1 + F2 = sum of forces (excites translation). Loads<br />
caused by substrate acceleration along the drive<br />
direction are included here.<br />
Subtract (A-2) from (A-1) to obtain the differential drive<br />
mode equation.<br />
(A-5)<br />
With perfect construction, the translation (A-4) includes<br />
the base motion while the differential motion (A-5) is free<br />
of base motion. Reorder (A-3).<br />
(A-6)<br />
With a large number of teeth, the differential drive force is<br />
much larger than the sum. The base beam mass is much<br />
Error Sources in In-Plane Silicon Tuning-Fork MEMS Gyroscopes 49
less than the proof masses. Therefore, set m b and SF to<br />
zero and solve (A-4) through (A-6) simultaneously for Sx,<br />
Dx, and x b .<br />
50 Error Sources in In-Plane Silicon Tuning-Fork MEMS Gyroscopes<br />
(A-7)<br />
where w H = eigenfrequency of hula (in-plane translation)<br />
mode<br />
=<br />
w d = drive frequency =<br />
Because of their larger lateral dimensions, proof masses<br />
match more closely than the spring stiffnesses; therefore,<br />
Dm in (A-7) was set to zero to obtain (1).<br />
appendix B. Derivation of sense Preamplifier Output<br />
The sense axis preamplifier output (4) and the demodulated<br />
output (5) are derived. Solve (2) and (3) simultaneously<br />
for the drive and sense axis positions x and y. Assume<br />
that fluid and suspension cross couplings b ds and k ds , the<br />
Coriolis coefficient 2mW I, and the force coupling a are<br />
small. Because is motion is driven by small terms, the sense<br />
position becomes a small term. Neglecting the products of<br />
small terms, the drive and sense positions are determined<br />
by:<br />
(B-1)<br />
(B-2)<br />
where s = Laplace transform of time derivative d/dt<br />
Because the drive oscillator loop requires that the drive<br />
loop operate at resonance, the drive position and force<br />
are sinusoids once steady-state operation is achieved; that<br />
is:<br />
x(t) = xocos(wdt) (B-3)<br />
Fd(t) = -bdxowdsin(wdt) (B-4)<br />
Since the sense mode resonant frequency is typically 10%<br />
different from the drive resonant frequency, the damping<br />
can often be neglected in determining the steady-state sense<br />
position magnitude. Solve (B-2) with (B-3) and (B-4).<br />
where<br />
q = phase shift through sense dynamics<br />
(B-5)<br />
=<br />
The hydrodynamic lift and the drive force coupling are inphase<br />
with the desired rate signal, while the suspension<br />
force coupling is out of phase. The sense position (B-5) can<br />
be written as:<br />
(B-6)<br />
where<br />
Fs = force acting in sense direction<br />
Fs = (abd – bds )xowdsin(wdt + q) + kdsxocos(wdt + q)<br />
The sense preamplifier output is determined from the<br />
circuit diagram of Figure 3. The sense plates below the<br />
proof masses are biased with opposite voltages (Figure 1)<br />
so that antiparallel vertical motion is detected. Because of<br />
the amplifier’s high gain, the preamplifier input, which is<br />
wired directly to the proof masses, is at virtual ground.<br />
Because the feedback resistor Rfb is large, the resistor<br />
and its Johnson noise are small effects at the gyro drive<br />
frequency wd .<br />
(B-7)<br />
Inserting (B-6) into (B-7) yields (4). Demodulation (Figure<br />
4) multiplies the output (4) by sin(w d t+j), a signal inphase<br />
with the drive velocity. High-frequency content is<br />
removed by low-pass filtering so that the output after ac<br />
gain and demodulation is described by (5), which includes<br />
a bias voltage from amplifier offsets in the dc chain.<br />
appendix C. Derivation of In-Phase Bias error from<br />
Force Coupling<br />
Equation (6) for calculating the in-phase bias caused by<br />
force coupling is derived. Since the TFG is operated at the<br />
drive resonance, the drive force amplitude on one proof<br />
mass is given by:<br />
(C-1)<br />
To calculate the angular rate errors, the undesired sense<br />
axis forces F s are compared to the Coriolis acceleration<br />
2mW I w d x o ; that is, the estimated rate is calculated<br />
from:<br />
(C-2)<br />
The undesired force is the drive force multiplied by the<br />
coupling coefficient a F . Inserting aF d from (C-1) into (C-2)
esults in (6). Because both the coupled and Coriolis forces<br />
act on the sense axis dynamics, the frequency separation<br />
denominator of (4) does not appear in (C-2).<br />
appendix D. In-Plane Quartz Gyroscope<br />
The quartz rate sensors (QRS) reached the market in the<br />
late 1980s, a decade before silicon MEMS devices were<br />
developed. The QRS has been a very successful product;<br />
therefore, a comparison with silicon TFGs is instructive.<br />
A typical Systron Donner/BEI QRS is shown in Figure 6.<br />
Per References [17] and [18], the actual designs differ<br />
depending on applications, which range from tactical to<br />
automotive. The H-shaped sensing mechanism is made of<br />
piezoelectric quartz, a significant variation from the electrostatically<br />
silicon gyros. Electrodes are deposited so that<br />
the upper tines are driven as a tuning fork with antiparallel<br />
motion in the substrate plane. Because of symmetric<br />
construction and mechanical coupling, the lower tines<br />
oscillate at the drive frequency, although they are not<br />
excited electrically. When the substrate is rotated about an<br />
axis parallel to the tines (Figure 6), the drive tines move<br />
into and out of the plane in response to the Coriolis acceleration,<br />
deflections that are coupled into the lower, sense<br />
tines. The sense electrodes are designed, deposited, and<br />
wired to sense the out-of-plane sense motion.<br />
Drive<br />
Tines<br />
Input Rate Rotational Rate<br />
DC Voltage<br />
Output<br />
Drive<br />
Oscillator<br />
Pickup<br />
Tines Pickup<br />
Amplifier<br />
(a)<br />
(b)<br />
Amplifier<br />
Amplifier<br />
Reference<br />
Demodulator<br />
Figure 6. BEI quartz rate sensor: (a) sensing mechanism,<br />
(b) schematic of operation. [18]<br />
Because of the piezoelectric material, drive and detection<br />
signals are at the same frequency for constant rate inputs,<br />
and gaps around the moving elements are much larger than<br />
the 1-4 µm typical of the electrostatically-driven devices.<br />
Silicon micromachining’s deposition, doping, and wafer<br />
bonding techniques are not available in quartz; therefore,<br />
quartz parts are generally limited to wafer thickness, which<br />
is greater than 100 µm (silicon parts are 5-20 µm thick or<br />
several hundred micron).<br />
The greater thickness and the required proximity of in- and<br />
out-of-plane eigenfrequencies results in moving elements<br />
larger than those of the silicon MEMS devices. Drive oscillation<br />
at 9 to 17 kHz dictates the length of the tines, while the<br />
continuous beams and the number of tines dictate that the<br />
tines and tip masses must be shaped carefully. [18] Because<br />
the wafers are 100 µm thick, the wafers are much smaller<br />
than those used in silicon processing. The combination of<br />
small wafers and large die tend to make the projected QRS<br />
costs higher than those for silicon rate sensors. Because of<br />
the thick part and large air gaps, sticking should not be an<br />
issue for the QRS. Because of the thicker parts and larger<br />
gaps that result in lower damping, it is possible that the<br />
QRS can be sealed at higher pressures than the TFG and<br />
still demonstrate low Brownian motion noise.<br />
The quartz’s etching characteristics are not as controlled<br />
as those of silicon because of the fundamental nature<br />
of quartz crystallographic properties and the etchants.<br />
The etching results in sidewalls (see “Error Mechanisms:<br />
Mechanical Quadrature”) that require each part, including<br />
automotive, be trimmed. [18] Trimming has been done by<br />
the addition of mass and by laser removal, a process that<br />
has been highly automated. For high-performance sensors,<br />
the level of quadrature trimming is suspected to be quite<br />
tight because the linear piezoelectric drive does not offer<br />
the possibility of quadrature nulling discussed in the “Error<br />
Mechanisms: Mechanical Quadrative” section.<br />
With piezoelectric operation, both the drive signals and the<br />
sense output are at the same frequency for no rate input. In<br />
electrostatically operated silicon devices, the drive voltages<br />
can be at different frequencies from the sensed output (see<br />
“Error Mechanisms: Electrical Coupling”). For the QRS, the<br />
sense and drive electrodes are physically separated in the<br />
H structure so that coupling within the sensor should be<br />
small; nevertheless, controlling stray capacitance is challenging.<br />
BEI has demonstrated proprietary electronics [18]<br />
that enable tactical performance so that other stray paths<br />
have been controlled.<br />
appendix e. analog Devices Out-of-Plane Gyroscopes<br />
Analog Devices began their gyro development with the<br />
ground rules that the instrument should be inexpensive<br />
but should satisfy automotive applications. To minimize<br />
expense, Analog’s accelerometer CMOS and polysilicon<br />
Error Sources in In-Plane Silicon Tuning-Fork MEMS Gyroscopes 51
process was mandated. In the mid-1990s, the process<br />
focused on 2-µm thick suspended parts. Based on performance<br />
considerations, Analog has moved to 4-µm thick<br />
suspended polysilicon parts. [38] The 4-µm thickness<br />
results in smaller moving parts, shorter beams, and smaller<br />
deflections than for the larger TFGs. To incorporate onchip<br />
circuitry, the substrate must be silicon. The moving<br />
elements, wire runs, and bonding pads are isolated from<br />
the conducting silicon substrate by an oxide layer.<br />
As shown in Figure 7, the gyro mechanism consists of two<br />
independent mechanical structures. [38] For each structure,<br />
the inner member is driven and sensed electrostatically. The<br />
sensing frame supports the driven member. An angular rate<br />
about an axis perpendicular to the substrate moves the driven<br />
mass along the sense direction (Figure 7), which is parallel to<br />
the substrate plane. As discussed below, the suspension is<br />
Coriolis Sense Fingers<br />
Coriolis Sense Fingers<br />
Drive Direction<br />
Inner Frame<br />
Resonating Mass<br />
Velocity Sense Fingers<br />
52 Error Sources in In-Plane Silicon Tuning-Fork MEMS Gyroscopes<br />
(a)<br />
(b)<br />
Drive Fingers<br />
Self Test<br />
Figure 7. Mechanism for Analog Devices ADXRS angular<br />
rate sensor: (a) photomicrograph, [41] (b) sketch<br />
of one proof mass assembly. [42]<br />
designed so that the sensing frame does not move in the drive<br />
direction, but follows the proof mass in the sense direction.<br />
Electrostatic combs detect the frame position.<br />
Eliminating trimming to reduce quadrature was a dominant<br />
decision in ADXRS design. [38]-[42] With crab leg or folded<br />
beam suspension, different beam stiffness can cause senseaxis<br />
motion when driving the proof mass. [40] Because this<br />
motion is in phase with position, it is in quadrature to the<br />
desired rate-induced motion. The ADXRS beam widths are<br />
1.7 µm, and width tolerances are 0.2 µm so that quadrature<br />
reduction was a major design goal. [38] Straight beams<br />
between the sense and drive elements (Figure 7) result in<br />
very little sense-axis motion. The beams have stress relief<br />
at their ends (not shown in Figure 7) to reduce longitudinal<br />
stresses from polysilicon thermal expansion and from<br />
drive motion. Although Analog has not employed it, a fine<br />
quadrature trim is possible by fingers excited to exert a<br />
sense force that is modulated by the drive motion. [43]<br />
In the ADXRS, both the sense and drive motions are parallel<br />
to the substrate’s plane; thus, all critical dimensions are<br />
done in one masking and etching operation. If the polysilicon<br />
thickness is off, all frequencies move together so<br />
that mode ordering is maintained. While the proof mass<br />
is driven at 7-µm amplitude, the sense motion for angular<br />
rate is roughly 10-10 m/rad/s, [38] an order of magnitude<br />
lower than for TFGs. This smaller motion is attributed to<br />
smaller drive amplitude, the fact that the drive mass must<br />
also drive the additional sense mass, and 20 to 30% separation<br />
of sense and drive resonant frequencies. The greater<br />
separation is consistent with 2-µm beam width compatible<br />
with 4-µm thickness and the resulting proof mass and<br />
suspension dimensions.<br />
The gyro consists of two mechanically independent mechanisms<br />
(not tuning forks, see “Mode Ordering” section)<br />
whose drive frequency is roughly 15 kHz and whose<br />
quality factor is 45. [38 ] The units are electrically crossconnected<br />
[42] so that the proof masses move antiparallel<br />
to common mode reject linear acceleration. To achieve<br />
common mode rejection with a Q of 45, the two drive<br />
resonant frequencies should be within 1% of each other.<br />
If the moving drive teeth are not centered with respect to<br />
the stationary teeth (i.e., the entire proof mass is moved<br />
relative to the stationary combs), a large coupling to drive<br />
force results. The coupling of drive force to sense-axis<br />
effects are described in (3). Since the drive force is large<br />
because of the high damping and since the drive force is<br />
in phase with the drive velocity and, hence, the Coriolis<br />
acceleration, the proof mass must be centered to very tight<br />
levels.<br />
With 1.7-µm wide beams, achieving the geometric control<br />
for sense drive frequency separation, matching drive<br />
frequencies, and centering the combs is challenging.
The ADXRS is hermetically sealed at 1 atmosphere.<br />
Because of the resulting damping, noise is limited by<br />
Brownian motion. [38] To achieve drive amplitude, the 5-V<br />
supplies must be boosted to approximately 12 V. Damping<br />
adds phase shift between sense and drive axes. Electronics<br />
design and increasing separation between sense and<br />
drive frequencies reduce the effect of this additional phase<br />
shift. The resulting damping renders the ADXRS tolerant<br />
of operating shock.<br />
The ADXRS relies heavily on its on-chip electronics to overcome<br />
the small size and low scale factor of the mechanical<br />
parts. The sense displacement per rate input is 10% and<br />
the capacitance variation is 1% of the 20-µm thick TFGs.<br />
Analog measures displacement resolution similar to the<br />
TFGs, but with much smaller capacitors.<br />
acknowledgments<br />
We gratefully acknowledge <strong>Draper</strong> <strong>Laboratory</strong>’s financial<br />
support and the dedicated work of <strong>Draper</strong>’s silicon fabrication<br />
and packaging groups. John Geen of Analog Devices<br />
offered fruitful insight into the ADXRS operation. Thanks<br />
to Beverly Tuzzalino for final preparation of the manuscript<br />
and to Neil Barbour for proofreading and discussions.<br />
references<br />
[1] Yazdi, N., F. Ayazi, and K. Najafi, “Micromachined Inertial<br />
Sensors,” Proc. IEEE, Vol. 86, No. 8, 1998, pp. 1640-59.<br />
[2] Bernstein, J., “An Overview of MEMS Inertial Sensing Technology,”<br />
Sensors, Vol. 20, No. 2, February 2003, pp. 14-21.<br />
[3] Ljung, P., Micromachined Gyroscopes with Integrated Electronics,<br />
Doctoral Thesis, EECS, University of California,<br />
Berkeley, CA, 1997.<br />
[4] Juneau, T., Micromachined Vibratory Rate Gyroscopes, Doctoral<br />
Thesis, EECS, University of California, Berkeley, CA,<br />
1997.<br />
[5] Clark, W.A., Micromachined Vibratory Rate Gyroscopes,<br />
Doctoral Thesis, EECS, University of California, Berkeley,<br />
CA, 1997.<br />
[6] Yates, R., C. Williams, et al., “A Micromachined Rotating<br />
Gyroscope,” IEE Colloquium on Silicon Fabricated Inertial<br />
Instruments, Savoy Place, London, UK, December 2, 1996.<br />
[7] Wood, D., G. Cooper, et al., “A Monolithic Silicon Gyroscope,”<br />
IEE Colloquium on Silicon Fabricated Inertial Instruments,<br />
Savoy Place, London, UK, December 2, 1996.<br />
[8] Paoletti, F., M.A. Gretillat, N.F. deRooij, “A Silicon Micromachined<br />
Vibrating Gyroscope with Piezoresistive Detection<br />
and Electromagnetic Excitation,” IEEE MEMS ‘96, February<br />
11-15, 1996.<br />
[9] Hashimoto, M., C. Cabuz, et al., Silicon Resonant Angular<br />
Rate Sensor Using Electromagnetic Excitation and Capacitive<br />
Detection, IOP Publishing Ltd., 1995.<br />
[10] Allen, J.J., R.D. Kinney, et al., “Integrated Micro-Electro-<br />
Mechanical Sensor Development for Inertial Applications,”<br />
Aerospace and Electronic Systems Magazine, IEEE, Vol. 13,<br />
No. 11, November 1998, pp. 36-40.<br />
[11] Tang, T.K., R.C. Gutierrez, et al., “Silicon Bulk Micromachined<br />
Vibratory Gyroscope,” Solid-State Sensor and Actuator<br />
Workshop, Hilton Head, SC, June 1996.<br />
[12] Logeeswaran, V.J., D.C.K. Ng, F.E.H. Tay, “A New Design<br />
Concept for Vibrating Microgyroscope,” SPIE Micromachining<br />
and Microfabrication, Singapore, November 28-30,<br />
2000.<br />
[13] Putty, M., A Micromachined Vibrating Ring Gyroscope, Doctoral<br />
Thesis, University of Michigan, Ann Arbor, MI, 1995.<br />
[14] Putty, M.W. and K. Najafi, “A Micromachined Vibrating Ring<br />
Gyroscope,” Solid-State Sensor and Actuator Workshop, Hilton<br />
Head, SC, June 13-16, 1994.<br />
[15] Leger, P., “Quapason-A New Low-Cost Vibrating Gyroscope,”<br />
Third St. Petersburg International Conference on Integrated<br />
Navigation Systems, St. Petersburg, Russia, 1994.<br />
[16] Leger, P., “Overview of the European MEMS Industry,” Yole<br />
Development, Accessed January 24, 2004, http://www.glennan.org/Documents/MEMS%20Europe.pdf.<br />
[17] Madni, A.M. and R.D. Geddes, “A Micromachined Quartz<br />
Angular Rate Sensor for Automotive and Advanced Inertial<br />
Applications,” Sensors, September 1999, pp. 26-33.<br />
[18] Madni, A.M., L.E. Costlow, S.J. Knowles, “Common Design<br />
Techniques for BEI Gyro Chip Quartz Rate Sensors for Both<br />
Automotive and Aerospace/Defense Markets,” IEEE Sensors<br />
J., Vol. 3, No. 5, 2003, pp. 569-78.<br />
[19] Lutz, M., W. Golderer, et al., “A Precision Yaw Rate Sensor in<br />
Silicon Micromachining,” Transducers ‘97, Chicago, IL.<br />
[20] Lutz, M., W. Golderer, et al., “The Bosch Process,” Accessed<br />
January 22, 2004, http://www.europractice.bosch.com/en/<br />
download/the_bosch_process.pdf.<br />
[21] Oskay, O., “Personal Communication,” O-Navi Micro Avionics,<br />
January 23, 2003.<br />
[22] Park, K.Y., C.-W. Lee, et al., “Laterally Self-Oscillated and<br />
Force-Balanced Micro Vibratory Gyroscope Packaged in<br />
a Vacuum Package with a Conditioning ASIC,” SPIE, Vol.<br />
3242, 1997.<br />
[23] An, S., Y. Oh, et al., “Force-Balanced Microgyroscope,” SPIE,<br />
Vol. 3242, 1997.<br />
[24] Andersson, G.I., N. Hedenstierna, et al., “A Novel Silicon<br />
Bulk Gyroscope,” Transducers ‘99.<br />
[25] Adams, S., J. Groves, K. Shaw, “A Single-Crystal Silicon Gyroscope<br />
with Decoupled Drive and Sense,” SPIE Conference<br />
on Micromachined Devices and Components V, Santa Clara,<br />
CA, September 1999.<br />
[26] Adams, S., J. Groves, K. Shaw, “SAR 10 Angular Rate Gyro,”<br />
Accessed 1/26/2005, http://www.sensonor.com/<br />
[27] Iyer, S.V., Modeling and Simulation of Non-idealities in a Zaxis<br />
CMOS-MEMS Gyroscope, PhD Thesis, Carnegie Mellon<br />
University, April 2003.<br />
[28] Iyer, S.V. and T. Mukherjee, “Simulation of Manufacturing<br />
Variations in a Z-Axis CMOS-MEMS Gyroscope,” 5 th International<br />
Conference on Modeling and Simulation of Microsystems<br />
(MSM), San Juan, Puerto Rico, April 22-25, 2002.<br />
[29] Acar, C. and A.M. Shkel, “Nonresonant Micromachined Gyroscopes<br />
with Structural Mode Decoupling,” IEEE Sensors<br />
Journal, Vol. 3, No. 4, 2003, pp. 497-506.<br />
Error Sources in In-Plane Silicon Tuning-Fork MEMS Gyroscopes 53
[30] Painter, C.C. and A.M. Shkel, “Structural and Thermal Modeling<br />
of a Z-Axis Rate Integrating Gyroscope,” Journal of Micromechanical<br />
Microengineering, Vol. 13, 2003, p. 229-37.<br />
[31] Bernstein, J., S. Cho, et al., “A Micromachined Comb-Drive<br />
Tuning-Fork Rate Gyroscope,” IEEE Microelectromechanical<br />
Systems, Fort Lauderdale, FL, February 7-10, 1993.<br />
[32] Bernstein, J. and M. Weinberg, Comb Drive Tuning Fork Gyroscope,<br />
U.S. Patent No. 5,349,855, September 27, 1994.<br />
[33] Tang, W.C., T.-C.H. Nguyen, et al., “Electrostatic Comb<br />
Drive of Laterally Driven Resonators,” Transducers ‘89, Montreaux,<br />
Switzerland, June 25-30, 1989.<br />
[34] Kwok, P.Y., M.S. Weinberg, K.S. Breuer, “Fluid Effects in Vibrating<br />
Micro-Machined Structures,” JMEMS, Vol. 14, No. 4,<br />
August 2005.<br />
[35] Crandall, S.H. and N.C. Dahl, eds., An Introduction to the<br />
Mechanics of Solids, McGraw-Hill Book Co., New York,<br />
1959.<br />
[36] Weinberg, M.S., K. Kumar, and A.T. King, Dynamically Balanced<br />
Micromechanical Devices, U.S. Patent No. 6,571,630<br />
B1, June 3, 2003.<br />
[37] Ward, P., Electronics for Coriolis Force and Other Sensors,<br />
U.S. Patent No. 5,481,914, January 9, 1996.<br />
[38] Geen, J.A., S.J. Sherman, et al., “Single-Chip Surface Micromachined<br />
Integrated Gyroscope with 50 °/h Allan Deviation,”<br />
IEEE Journal of Solid State Circuits, Vol. 37, No. 12,<br />
2002, pp. 1860-6.<br />
[39] Geen, J.A. and D.W. Carow, Micromachined Devices, U.S.<br />
Patent No. 6,684,698 B2, February 3, 2004.<br />
[40] Geen, J.A. and D.W. Carow, Micromachined Gyros, U.S. Patent<br />
No. 6,122,961, September 26, 2000.<br />
[41] Geen, J. and D. Krakauer, “New iMEMS Angular-Rate-Sensing<br />
Gyroscope,” Analog Dialogue, Vol. 37, No. 1, January<br />
2003, pp. 12-5.<br />
[42] Geen, J.A. and D.W. Carow, Micromachined Gyros, U.S. Patent<br />
No. 6,505,511 B1, January 14, 2003.<br />
[43] Clark, W.A., T.N. Juneau, et al., Dual-Mass Vibratory Rate<br />
Gyroscope with Suppressed Translational Acceleration Response<br />
and Quadrature-Error Correction Capability, U.S.<br />
Patent No. 6,230,563 B1, May 15, 2001.<br />
54 Error Sources in In-Plane Silicon Tuning-Fork MEMS Gyroscopes
(l-r) Anthony Kourepenis<br />
and Marc Weinberg<br />
bios<br />
Marc Weinberg is a <strong>Laboratory</strong><br />
Technical Staff Member. He has<br />
been responsible for the design<br />
and testing of a wide range<br />
of traditional micromechanical<br />
gyroscopes, accelerometers,<br />
hydrophones, microphones, angular displacement sensors, chemical sensors, and biomedical devices. He holds 25 patents with<br />
12 additional in application. He served in the United States Air Force at the Aeronautical System Division, Wright-Patterson<br />
Air Force Base during 1974 and 1975, where he applied modern and classical control theory to design turbine engine controls,<br />
and at the Air Force Institute of Technology, where he taught gas dynamics and feedback control. He has been a member of the<br />
American Society of Mechanical Engineers (ASME) since 1971. Dr. Weinberg received BS (1971), MS (1971), and PhD (1974)<br />
degrees in Mechanical Engineering from MIT where he held a National Science Foundation Fellowship.<br />
Anthony Kourepenis is currently Associate Director of the Tactical Programs Office at <strong>Draper</strong> <strong>Laboratory</strong>. He has been principally<br />
involved with the design of solid-state inertial instruments and has been the technical lead for several successful instrument and<br />
systems design, development, and demonstration programs. His diverse background includes experience in both hardware and<br />
software design, applied physics, data acquisition and analysis, sensor, instrument, and systems design, electronics architecture<br />
development, test and evaluation, error modeling and interpretation, and signal processing. He holds six patents and has four<br />
pending. Dr. Kourepenis received BSEE (1988) and MSEE (1992) degrees from Northeastern University and an MSEM (1996)<br />
from Tufts University.<br />
Error Sources in In-Plane Silicon Tuning-Fork MEMS Gyroscopes 55
56<br />
Model-Based Variational Smoothing<br />
and Segmentation for Diffusion<br />
Tensor Imaging in the Brain<br />
Mukund N. Desai, 1 David N. Kennedy, 2 Rami S. Mangoubi, 1 et al.<br />
Copyright © 2006 Humana Press, Inc. Published in Neuroinformatics, Vol. 4, No. 3, 2006, pp. 217-234<br />
abstract<br />
This paper applies a unified approach to variational smoothing<br />
and segmentation to brain diffusion tensor image data<br />
along user-selected attributes derived from the tensor, with<br />
the aim of extracting detailed brain structure information.<br />
The application of this framework simultaneously segments<br />
and denoises to produce edges and smoothed regions within<br />
the white matter of the brain that are relatively homogeneous<br />
with respect to the diffusion tensor attributes of choice. The<br />
approach enables the visualization of a smoothed, scaleinvariant<br />
representation of the tensor data field in a variety<br />
of diverse forms. In addition to known attributes such as<br />
fractional anisotropy, these representations include selected<br />
directional tensor components and, additionally associated<br />
continuous valued edge fields that may be used for further<br />
segmentation. A comparison is presented of the results of<br />
three different data model selections with respect to their<br />
ability to resolve white matter structure. The resulting<br />
images are integrated to provide a better perspective of the<br />
model properties (edges, smoothed image, etc.) and their<br />
relationship to the underlying brain anatomy. The improvement<br />
in brain image quality is illustrated both qualitatively<br />
and quantitatively, and the robust performance of the algorithm<br />
in the presence of added noise is shown. Smoothing<br />
occurs without loss of edge features due to the simultaneous<br />
segmentation aspect of the variational approach, and the<br />
output enables better delineation of tensors representative of<br />
local and long-range association, projection, and commissural<br />
fiber systems.<br />
Introduction<br />
Diffusion weighted and diffusion tensor magnetic resonance<br />
imaging (MRI) has come into widespread use over the<br />
past few years. This is mainly because of the unique view<br />
diffusion imaging provides of the microstructural details<br />
within the cerebral white matter in health and disease. As it<br />
represents a relatively new class of image data, the processing<br />
required for visualization and analysis of tensor data<br />
provides numerous new challenges.<br />
1 Control and Information Systems Division, <strong>Draper</strong> <strong>Laboratory</strong>, Cambridge, MA.<br />
2 Center for Morphometric Analysis and Massachusetts General Hospital (MGH)/MIT Athinoula A. Martinos Center<br />
for Biomedical Imaging, Department of Neurology, MGH, Boston.
The history and general descriptions of the standard methods<br />
for diffusion imaging are discussed in detail in recent<br />
reviews of the field. [1]-[3] Diffusion imaging has been used in<br />
a host of clinical and research application areas. [4]-[13] The<br />
ability to use diffusion tensor imaging (DTI) directionality<br />
and anisotropy to characterize the compact portion of<br />
discrete corticocortical association pathways in the cerebral<br />
white matter of living humans has been demonstrated and<br />
validated. [14] Identification and visualization of specific fiber<br />
tracts [15]-[24] and exploration of the potential to elicit information<br />
about functional specificity [25] have also been carried<br />
out. The wide variety of application areas, along with the<br />
fact that the novel in vivo data are obtainable in this fashion<br />
makes DTI a potentially powerful clinical tool.<br />
Compared with conventional MRI, however, DTI image<br />
acquisition is quite slow, due to the need to encode multiple<br />
different directions of diffusion sensitivity. This leads<br />
to practical tradeoffs in the use of DTI between acquisition<br />
time, diffusion sampling method, spatial resolution, and<br />
slice coverage. Partial volume effects are particularly problematic<br />
in DTI since competition of multiple different directional<br />
features within a voxel can render the resultant tensor<br />
not representative of the underlying anatomic structure. The<br />
development of methods that take optimal advantage of the<br />
diffusion data in light of potentially low signal-to-noise ratio<br />
(SNR) is an important objective for making DTI more clinically<br />
relevant.<br />
Prior work in regularizing or smoothing diffusion tensor<br />
fields include the work in Reference [15], where a Markovian<br />
model is proposed to track brain fiber bundles in the DTI<br />
data. Diffusion direction is applied to fiber tract mapping<br />
and smoothing in Reference [26], in which the total variation<br />
norm algorithm is applied to the raw data. Regularization<br />
of diffusion-based direction maps to track brain white<br />
matter fascicles is reported in Reference [21], in which the<br />
emphasis is on the use of prior information in a Bayesian<br />
framework, and in Reference [27], in which the paths of<br />
anatomic connectivity are determined based on the directionality<br />
of the tensor. A continuous field approximation<br />
of discrete DTI data has been applied in Reference [28] to<br />
extract microstructural and architectural features of brain<br />
tissue. Smoothing employing parametric patches has been<br />
applied in Reference [23] to three-dimensional (3D) scattered<br />
data that describe anatomic structure.<br />
In this paper, we present an algorithm for simultaneous<br />
smoothing or denoising and segmentation of diffusion<br />
tensor data. This algorithm smooths the image field within<br />
homogeneous regions, while at the same time preserves the<br />
edges of these regions at discontinuities by generating the<br />
associated edge fields based on user-selected tensor attributes.<br />
The smoothing and edge estimation are applied with<br />
respect to a user-selectable “mapping,” or models, of the<br />
input tensor data in order to emphasize specific properties of<br />
the tensor. Sample application of the algorithm is presented<br />
that demonstrates smoothing with respect to normalized<br />
tensor magnitude and principal eigenvector direction. In<br />
these examples, the identification of white matter anatomic<br />
structure is qualitatively enhanced and reduction of regional<br />
anisotropy variance is quantified. This reduction in variance<br />
is then shown to be robust in the presence of added noise.<br />
While demonstrated with respect to specific data models,<br />
this simultaneous smoothing and segmentation framework<br />
is general and opens a rich and versatile set of processing<br />
options to address the noisy, voxel-averaged sampling of<br />
DTI data. It also enables the selection of appropriate models<br />
of various physical characteristics of the diffusion tensor in<br />
cerebral white matter. Specific clinical objectives will dictate<br />
the optimal selection of “mapping” models and parameters<br />
for enhanced smoothing and segmentation and will be the<br />
focus of future studies.<br />
Materials and Methods<br />
Data Acquisition<br />
The sample data used in this paper used the following protocol:<br />
Siemens 1.5 Tesla Sonata, five sets of interleaved axial<br />
slices to provide 2 × 2 × 2 mm 3 contiguous coverage, singleshot<br />
echo-planar imaging (EPI) with six directional diffusion<br />
encoding directions, and a nonencoded baseline acquisition<br />
was performed with TR = 8 s, TE = 96 ms, averages = 12,<br />
number of slices = 12 per interleave, data matrix = 256 (readout)<br />
× 128 (phase encode), and diffusion sensitivity b = 568<br />
s/mm 2 . The total imaging time for the session was approximately<br />
45 minutes. The subject provided informed consent<br />
and was a 35-year old, right-handed male normal control<br />
from a study of schizophrenia. The Institutional Review<br />
Board of the Massachusetts General Hospital approved the<br />
study protocol.<br />
Computation of the Diffusion Tensor Attributes<br />
Once the diffusion tensor, g, is sampled, the magnitude (or<br />
trace) can be calculated to express the total (no directionality)<br />
diffusivity at the voxel location. The directionality of<br />
the diffusion is assessed by an eigen decomposition of the<br />
diffusion tensor<br />
where l i , s i , i = 1,…3 are the three eigenvalue-eigenvector<br />
pairs for the tensor with eigenvectors of unit magnitude. The<br />
largest eigenvalue and the associated eigenvector correspond<br />
to the major directionality of diffusion at that location. The<br />
fractional anisotropy fa [29] is a scalar measure that is often<br />
used to characterize the degree to which the major axis of<br />
diffusion is significantly larger than the other orthogonal<br />
directions.<br />
Specifically regarding brain imaging, to the extent that<br />
white matter fiber systems have homogeneous directionality<br />
at the spatial scale of the voxel size, these fiber systems<br />
Model-Based Variational Smoothing and Segmentation for Diffusion Tensor Imaging in the Brain 57
are expected to demonstrate significant anisotropy. More<br />
general eigenvalue/eigenvector-based scalar as well as vector<br />
and tensor features can be used to capture the underlying<br />
structure in the diffusion tensor image.<br />
We have developed a segmentation and smoothing approach<br />
that permits user selection among these (and other) features<br />
of the tensor image in order to capture the relevant underlying<br />
structural details.<br />
The Approach<br />
The core concept of the method is the simultaneous variational<br />
segmentation and smoothing formulation. Given<br />
an observed tensor field, g, the objective is to obtain<br />
two outputs: the smoothed tensor u, and edge field v.<br />
These outputs, respectively, represent the simultaneous<br />
smoothing and segmentation of the raw tensor data. The<br />
approach, shown schematically in Figure 1, makes use of<br />
the following:<br />
• A specified data fidelity model H(u, g).<br />
• A continuity model, f(u), that forms a basis for adaptively<br />
determining the regions of continuity within<br />
which smoothing is to take place.<br />
Energy Functional<br />
In general, we may consider a region of interest W in a<br />
Euclidean space R n . Let x designate the pixel position in<br />
W. Thus, for 3D spatial data, we have n = 3. Our results are<br />
based on the processing of a slice from a brain image, so n =<br />
2, and W is a two-dimensional (2D) region, and the vector<br />
x is a 2D position vector in, for instance, Cartesian coordinates.<br />
Over this region W, estimation of a field u = u(x) is<br />
of interest, and measurements g = g(x) are collected. The<br />
following energy functional [30] for scalar fields is based on<br />
the energy functional of References [31] and [32]<br />
Raw Tensor Data, g<br />
Specifications of:<br />
(1) Weights a, b, r<br />
(2) Data Fidelity Model, f<br />
(3) Data Continuity Model, h<br />
Variational Segmentation<br />
and Smoothing<br />
58 Model-Based Variational Smoothing and Segmentation for Diffusion Tensor Imaging in the Brain<br />
(1)<br />
Edge Data, v<br />
Smoothed Data, u<br />
We generalize the above functional to vector field smoothing<br />
(introduction of tensor notation at this stage, although<br />
more cumbersome, provides no additional insight) with the<br />
introduction of the data fidelity and continuity functions<br />
(h 1 (u), h 2 (g)), and f(u), respectively<br />
For a given data g and choices of functions h 1 (u), h 2 (g), and<br />
f(u), the energy functional is minimized with respect to u<br />
and v. Input data g and smoothed data u are vector fields<br />
(tensor processing can be recast as vector processing) of<br />
dimensions m and r, respectively, whereas v is a scalar field<br />
that represents the edges of the smoothed vector field u.<br />
Further g, u and v are continuous n-dimensional fields and<br />
are defined for all x in region W in an n dimensional space x.<br />
The first term in the above functional represents a smoothing<br />
penalty term that favors spatial smoothness of vector<br />
field f(u), rather than of u, at all interior points of the region,<br />
where edge field v
of edges. The constants a, b, and r represent the chosen<br />
weights on the accompanying cost components and determine<br />
the nominal smoothing radius, the edge width, as well<br />
as govern the value of edge function v. Specifically, the ratio<br />
a/b is related to the nominal smoothing radius, r to the<br />
edge width, and a governs the edge strength. Further details<br />
governing the choice of constants a, b, and r is discussed<br />
in Reference [33]. For more details on the segmentation<br />
approach and on the results of the application of the functional<br />
for smoothing and segmentation of phantom, MRI<br />
and functional magnetic resonance imaging (fMRI) scalar<br />
data, as well as for the fusion of different modality data, see<br />
References [33]-[36] and the references therein.<br />
The edges are estimated based on continuity attributes f(u)<br />
of the smoothed tensor field u and the specified prior model<br />
on edge field. The Euler Lagrange equations that are the<br />
necessary conditions associated with the minimization of<br />
the energy functional can be solved by the gradient descent<br />
method (e.g., References [33]-[35]).<br />
From the outputs u and v, additional relevant attributes<br />
associated with size, shape, and orientation of the diffusion<br />
ellipsoid may be distilled for further analysis. Example attributes<br />
include the trace (for diffusion magnitude), anisotropy<br />
measures (for diffusion “shape”), and the direction<br />
of eigenvectors (for diffusion orientation). [37] The ability<br />
to select functions f(u) and h1(u), h2(g) to satisfy various<br />
continuity and data fidelity requirements, respectively, is an<br />
important advantage that enables the viewing of the same<br />
DTI data from different perspectives.<br />
Application to DTI Data<br />
Depending on the objective, one can select the continuity<br />
functions h1(u), h2(g) and fidelity function f(u) to obtain<br />
an edge field v and an accompanying smoothed tensor<br />
field u with respect to specific features of the data. Differential<br />
smoothing concerns can thus be applied to different<br />
weighted eigenspace components of the tensor, and more<br />
generally, to any other sets of attributes of the tensor.<br />
We next illustrate two different models that capture different<br />
characteristics of spatial similarity for the tensor data<br />
by selection of different forms of continuity function f(u)<br />
and the data fidelity function h2 (g) while retaining the same<br />
form of function h1 (u) = u<br />
(a) Normalized tensor smoothing<br />
(b) Dominant directional tensor component smoothing<br />
where l1 is the maximum of the three eigenvalues of the<br />
tensor g.<br />
The first model represents a scale-invariant continuity criterion<br />
for the tensor data g. By contrast, the second model<br />
assumes the same invariance continuity criterion as the<br />
first, but with respect to only the subspace of tensor g associated<br />
with its dominant eigenvector s 1 . The objective of<br />
identifying regions of spatial continuity within the image, or<br />
equivalently, segmenting, motivates the choice of model. It<br />
may be noted that for dominant directional tensor smoothing<br />
in (b) above, we have chosen to work in the rank-1<br />
dominant tensor space s 1 s T 1 rather than the vector space of<br />
associated direction s 1 .<br />
For measures, we adopt the following choices for F, H of<br />
Eq. (2)<br />
Model-Based Variational Smoothing and Segmentation for Diffusion Tensor Imaging in the Brain 59<br />
(3)<br />
(4)<br />
where F and H represent the Euclidean norm of the gradient<br />
of f(u) and the estimated error u - h 2 (g), respectively.<br />
Assessment<br />
In order to assess the results of the application of this processing<br />
to clinically relevant DTI data, we selected a representative<br />
axial slice that included a comprehensive set of neuroanatomic<br />
white matter regions of interest (ROIs). These anatomic<br />
regions include the corpus callosum, internal capsule,<br />
superior longitudinal fasciculus, and cingulum bundle.<br />
First, we visually inspect the results of the smoothing<br />
modes on the appearance of fractional anisotropy (fa) maps<br />
as well as in visualization of tensor orientation information.<br />
Second, we quantify these observations by evaluating the<br />
distribution of fa values over the anatomic regions listed<br />
above. Third, we evaluate the sensitivity of the proposed<br />
methodology by comparing, using images and the change<br />
in performance with traditional methods when noise is<br />
added to the raw data. We choose to add Gaussian noise at<br />
increasing levels to the data, with negative values set to zero<br />
to remain within the physical constraint of non-negative<br />
intensity. In addition to comparing the proposed method<br />
and the traditional approach using images, we also quantify<br />
the effect of noise on the performance of the proposed<br />
approach in terms of the coefficient of variation of the fa<br />
over each anatomic region of interest.<br />
results<br />
In this section, we demonstrate the operation of the algorithm<br />
in the context of two different smoothing models,<br />
characterize this processing in the context of anatomic<br />
information contained within the DTI data, and summarize<br />
some of the noise properties of the implementation. Figure<br />
2 demonstrates a number of different views of the results<br />
of this smoothing procedure on an axial brain slice. This<br />
includes the raw (unsmoothed) data in the first column as<br />
well as the results of the two different smoothing models:<br />
normalized tensor in the second column, and directional<br />
projection in the third column. The “cuboid” and color<br />
representations [38] of the directional information contained
Edges, n<br />
Fractional<br />
Anisotropy, fa<br />
‘Cuboid’<br />
Display<br />
Directional<br />
Color Coding<br />
Unsmoothed<br />
Smoothed<br />
Normalized<br />
Tensor<br />
60 Model-Based Variational Smoothing and Segmentation for Diffusion Tensor Imaging in the Brain<br />
Smoothed<br />
Directional<br />
Projection<br />
Figure 2. Effect of two smoothing models (2 nd and 3 rd columns) on an axial brain slice. The fractional anisotropy and edge<br />
maps are displayed in the first two rows, and the “cuboid” and color representations of the directional information<br />
contained in the resultant tensor fields are displayed in the last two rows. Maximum details emerge when smoothing<br />
is most selective, directional projection based (3 rd column), within the edge field boundaries.
in the resultant tensor fields are presented in the third and<br />
fourth rows, respectively.<br />
From the edge field visualization in the first row, it is clear<br />
that the most details consistent with the anatomic structure<br />
emerge when smoothing is most selective within the<br />
edge field boundaries. Specifically, the edge map in the<br />
third column, which is based on the directional projection,<br />
displays more details than the edge map in the second<br />
column, which is based on the normalized tensor.<br />
The second row of images indicates that the impact of<br />
edge preservation on the smoothing of the tensor field<br />
and its components can also be appreciated from the fa<br />
images for the smoothed tensor. The raw data’s fractional<br />
anisotropy is shown in the first column for comparison.<br />
It might be remarked that by definition, the fractional<br />
anisotropy of the directional component in the raw data<br />
will be unity and of interest is the deviation from unity that<br />
arises from the spatial variation of the dominant direction<br />
component that is reflected in the smoothing. The quantitative<br />
impact of different modes of smoothing is presented<br />
Table 1.<br />
in Table 1. This includes the mean and standard deviation<br />
of the functional anisotropy fa (as well as the coefficient of<br />
variation (CV)) for five anatomically motivated and manually<br />
defined regions annotated in Figure 3. These regions<br />
were identified by a trained neuroanatomist using both<br />
tensor orientation and anisotropy information. For the case<br />
of normalized tensor smoothing, SNR, or equivalently the<br />
reciprocal of the CV, is improved for all regions except for<br />
lateral ventricle whose edges with the adjacent region of the<br />
internal capsule are not well delineated, resulting in loss of<br />
restricted regional smoothing at the border of that region. For<br />
the case of directional smoothing, SNR values are uniformly<br />
enhanced for all regions due to better regional edge details<br />
and attendant region limited smoothing. The CV is reduced<br />
by at least 2.5-fold when comparing directional smoothing<br />
to the original measures of anisotropy, indicating a concomitant<br />
increase in the resultant SNR for these measures.<br />
The “cuboid” displays in the third row of Figure 2 can explain<br />
the superior performance of the directional projection method<br />
in the third column. These cuboid displays are better appreciated<br />
by looking at a closeup of particular regions, as is done in<br />
Raw Tensor fa Smoothed Smoothed Dominant<br />
Normalized Directional Tensor<br />
Tensor fa Component fa<br />
Corpus Callosum<br />
Mean (m) 0.646 0.5806 0.9575<br />
Std. Dev (s) 0.117 0.1014 0.0493<br />
CV (100 s/m) 18.1 17.46 5.14<br />
Cingulum Bundle<br />
Mean (m) 0.5524 0.4306 0.9238<br />
Std. Dev (s) 0.151 0.0953 0.0515<br />
CV (100 s/m) 27.3 22.13 5.57<br />
Internal Capsule<br />
Mean (m) 0.3615 0.28 0.9308<br />
Std. Dev (s) 0.0768 0.0493 0.0620<br />
CV (100 s/m) 21.24 17.61 6.67<br />
Superior Longitudinal<br />
Fasciculus<br />
Mean (m) 0.5676 0.4928 0.9496<br />
Std. Dev (s) 0.1078 0.0799 0.0598<br />
CV (100 s/m) 18.99 16.21 6.30<br />
Lateral Ventricle<br />
Mean (m) 0.2647 0.2078 0.8103<br />
Std. Dev (s) 0.1136 0.1233 0.0883<br />
CV (100 s/m) 42.92 59.34 10.90<br />
This table demonstrates the quantitative impact of different modes of smoothing and segmentation in<br />
terms of mean, standard deviation and coefficient of variation (CV) statistics of fractional anisotropy fa in<br />
five different regions of the brain for the particular 2-D slice of DTI data shown in Figure 4. The CVs are<br />
lowest, an indication that directional smoothing yields effective segmentation of homogeneous regions.<br />
Model-Based Variational Smoothing and Segmentation for Diffusion Tensor Imaging in the Brain 61
CC Corpus Callosum<br />
IC Internal Capsule<br />
SLF Superior Longitudinal<br />
Fasciculus<br />
CG Cingulum Bundle<br />
lv Lateral Ventricle<br />
Figure 3. Manual delineation of five anatomically motivated<br />
regions for further analysis (Figure 6, Table<br />
1) of impact of different modes of smoothing<br />
and segmentation on fractional anisotropy of<br />
smoothed tensor in the regions. Delineations<br />
were based on tensor orientation and anisotropy<br />
and are shown with respect to the fractional<br />
anisotropy map here.<br />
the second row of Figure 4. The closeup region, a portion of<br />
the cerebral hemisphere, is indicated in the top image of the<br />
first row. We added images displaying the dominant direction<br />
vectors for the raw data, the smoothed normalized tensor,<br />
and the smoothed directional projection in the third row of<br />
Figure 4 for the sake of comparison. Again, we see that direction<br />
details are better kept using the smoothed directional<br />
projection. One example is the region above the thick arrows,<br />
where directional (curved corners) structure is preserved in<br />
the directional image, but smoothed over in the normalized<br />
tensor image. Comparison of other parts of the closeup views<br />
leads to a similar conclusion. It is this preservation of the higher<br />
dimensional directional characteristics of the tensor at the pixel<br />
level that is responsible for the superior image obtained from<br />
the directional projection method.<br />
We now consider added noise, our third assessment<br />
criterion. The effect of added noise is evaluated to<br />
establish the robustness of the approach. In Figures 5<br />
and 6, we compare the results of increasing noise levels<br />
added to the raw data. Levels of the additional noise<br />
range from 0 (no simulated noise added) to approximately<br />
5 times the estimated sigma value. The sigma<br />
62 Model-Based Variational Smoothing and Segmentation for Diffusion Tensor Imaging in the Brain<br />
value was estimated from the raw data outside the<br />
brain. These images include: top row – raw data fractional<br />
anisotropy (fa); second row – smoothed fractional<br />
anisotropy; third row – our edge field v; bottom<br />
row - conventional Sobel edge field of raw fa. Using<br />
anatomically-based ROIs, Figure 6 illustrates, for the<br />
corpus callosum region, that the smoothed tensorbased<br />
estimate of regional anisotropy fa in the second<br />
row of Figure 5 has a substantially lower coefficient of<br />
variation (bottom curve in Figure 6) than the original<br />
data (top curve in Figure 6); the reduction is by almost<br />
a factor of 10. Similar reductions were obtained for all<br />
other regions of Figure 4: cingulum bundle, superior<br />
longitudinal fasciculus, and internal capsule. Additionally,<br />
as Figure 5 indicates, comparison of edge fields<br />
from our approach on the third row with a conventional<br />
Sobel edge field on the fourth row illustrates that, while<br />
added noise has a deleterious effect on the Sobel edge<br />
field, the new models introduced to the energy functional<br />
preserve details even as noise is added.<br />
Discussion<br />
The above results demonstrate the model-based variational<br />
segmentation functional approach’s ability to provide a<br />
diverse collection of output images within a unified framework.<br />
The usefulness of the variational segmentation function<br />
approach has been demonstrated for other forms of<br />
brain imaging, such as structural [34] and functional magnetic<br />
resonance imaging data. [35]<br />
The versatility of these functionals, in their ability to<br />
produce a diverse collection of output images, is an important<br />
addition to the methods or tools available for image<br />
analysis. This innovation provides a unified framework<br />
for spatially selective smoothing of noisy brain image<br />
data along attributes of choice derived from the diffusion<br />
tensor whereby we can adaptively determine smoothed<br />
regions within the white matter that are relatively homogeneous<br />
with respect to specific tensor properties of<br />
shape, size, and orientation of the associated diffusion<br />
ellipsoid. In addition to providing a demarcation of the<br />
regions with respect to user-specified attributes of homogeneity<br />
in the DTI data, the segmentation functional is<br />
amenable and flexible to using prior information on attributes<br />
of both the tensor and edge field with incorporation<br />
of additional penalty terms in the functional. Determining<br />
smoothed regions with specific tensor properties<br />
enhances the ability to characterize the morphometric<br />
properties of the compact portion, or “stem,” of the major<br />
white matter pathways in regions where partial volume<br />
problems and the validity of the tensor assumption are<br />
less problematic. [14]<br />
A comparison has been presented of attributes such as<br />
anisotropy and direction of diffusion for the raw tensor<br />
itself without smoothing, the smoothed normalized tensor,
Fractional<br />
Anisotropy, fa<br />
‘Cuboid’<br />
Display<br />
Dominant<br />
Direction<br />
Unsmoothed<br />
Smoothed<br />
Normalized<br />
Tensor<br />
Smoothed<br />
Directional<br />
Projection<br />
Figure 4. Closeup displays demonstrate the effect of normalized tensor (2 nd column) and directional projection (3 rd column)<br />
smoothing more clearly by displaying the ‘cuboid’ (2 nd row) and dominant direction vector (3 rd row) of the principal<br />
eigenvector for these two models for a portion of the cerebral hemisphere marked on fractional anisotropy display.<br />
Region above thick arrows are one example where directional projection preserves details more visibly.<br />
Model-Based Variational Smoothing and Segmentation for Diffusion Tensor Imaging in the Brain 63
Raw or<br />
Original<br />
fa<br />
Smoothed<br />
fa<br />
Our<br />
Edge Field<br />
v<br />
Conventional<br />
Sobel<br />
Edge Field<br />
Sigma Level<br />
of Added<br />
Noise<br />
sobeledge sobeledge sobeledge sobeledge sobeledge sobeledge<br />
0 1 2 3 4 5<br />
Original<br />
Data<br />
Increasing Noise Level<br />
Figure 5. Effect of added noise on raw fa, smoothed fa, our edge field v, and conventional Sobel edge field.<br />
The directional projection-based smoothing and segmentation (2 nd and 3 rd) row are more robust to<br />
added noise.<br />
Coefficient of Variation<br />
Corpus Callosum<br />
20<br />
18<br />
16<br />
14<br />
12<br />
10<br />
8<br />
6<br />
4<br />
2<br />
0<br />
fa-sm fa-sm fa-sm fa-sm fa-sm fa-sm<br />
edge-sm edge-sm edge-sm edge-sm edge-sm edge-sm<br />
Original<br />
Data<br />
Original<br />
Smoothed<br />
0 1 2 3 4 5<br />
Sigma level of Added Noise<br />
64 Model-Based Variational Smoothing and Segmentation for Diffusion Tensor Imaging in the Brain<br />
Figure 6. Effect of noise on smoothing. The<br />
coefficient of variation of the smoothed fa<br />
(bottom curve) corresponding to the second<br />
row of images in Figure 5 is significantly<br />
lower than that of the raw or original fa<br />
(top curve) corresponding to the first row<br />
of Figure 5. Curves are for corpus callosum<br />
region. Similar results obtain for other<br />
regions in Figure 3.
and the smoothed tensor component associated with the<br />
dominant eigenvector. The underlying diffusion characteristics<br />
of the white matter in the brain motivate the choice<br />
of these mappings, whereas normalization provides scale<br />
invariance of salient features. Therefore, it is possible to<br />
visualize attributes of anisotropy and direction of the resultant<br />
tensor fields and the associated edge field in various<br />
ways. In this fashion, the applicability of a unified and<br />
versatile image processing framework for smoothing and<br />
feature extraction in support of fiber pathway identification<br />
within the human brain is demonstrated.<br />
Specifically, promise of the utility of the variational simultaneous<br />
smoothing and segmentation functional to improve<br />
the characteristics of tensor-valued imaging data has been<br />
demonstrated. The result is an improvement of the overall<br />
signal that preserves the anatomic detail. Within the<br />
directional component smoothing case, regions of discrete<br />
directionality are smoothed, but transitions between<br />
regions are well preserved. This can be particularly well<br />
seen as one traverses from the cortex toward the central<br />
portion of the images shown in Figure 4. The white matter<br />
contained within the gyral folds near the cortex remains<br />
nicely visualized and oriented “out” of the gyri. Transitions<br />
of radially oriented white matter of the corona ratiata and<br />
U fibers with the perpendicularly oriented internal capsule<br />
and various associational pathways are clearly demarked.<br />
This level of detail is only retained in the directional<br />
smoothing case. Finally, it should be noted that visualization<br />
based on the dominant direction coding in Figure 2 is<br />
less sensitive to the underlying variations and noise structure,<br />
presumably due to the subtleties of the variations in<br />
intensity of directional noise compared to the large color<br />
differences of the different fiber systems. For the images<br />
examined, directional smoothing thus seems appropriate<br />
because of the simple fact that it simultaneously smooths<br />
while preserving directionality. This smoothing can act as<br />
a preprocessing step for virtually any subsequent processing<br />
of the diffusion data, such as between group analyses<br />
of anisotropy data, [11],[39] anatomic regional characterization,<br />
[40] and tractographic reconstruction. [41]-[43]<br />
Turning to the results of Figures 5 and 6, we examine<br />
respectively two aspects: the edges and the coefficient of<br />
variation over ROIs. First, as the graph demonstrates, the<br />
coefficient of variation of fa calculated over the anatomic<br />
region of the corpus callosum is dramatically reduced<br />
(improved) with simultaneous smoothing and segmentation,<br />
and that this substantial improvement holds even in<br />
the presence of the greatly reduced image quality at the<br />
maximum added noise.<br />
Turning to the edges in Figure 5, we observe that with<br />
incrementally increasing noise added to the raw data,<br />
the conventional (Sobel) edge field is seen to deteriorate<br />
more rapidly. By contrast, with our approach, edges are<br />
maintained at the increased noise levels. This result is a<br />
direct consequence of working with a most dominant<br />
feature of the tensor, specifically, the dominant rank-1<br />
tensor.<br />
Limitations<br />
A method that is generalizable in terms of processing image<br />
data and its dimensionality is presented. The application<br />
used to illustrate the processing, namely DTI, is an important<br />
and new radiological tool for the clinical assessment of<br />
cerebral white matter. Processing can improve the resultant<br />
SNR without penalizing the resultant spatial resolution, and<br />
thus can enhance the utility of these measurements. This<br />
improvement in SNR can be used to shorten the potentially<br />
lengthy diffusion acquisition time. It is acknowledged that<br />
the tensor acquisition may not be optimal for observation<br />
of specific fiber tracts themselves, and that this acquisition<br />
optimization is an open research question. These<br />
processing tools, however, will extend to a higher order<br />
(i.e., q-space and high angular resolution) diffusion acquisitions,<br />
[44]-[46] and can still play an important role in the<br />
processing and analysis of these classes of data acquisition.<br />
Indeed, the utility of submodel-based smoothing becomes<br />
even more important as the complexity of the input data<br />
increases. The flexibility of the methods we report here can<br />
be adapted easily for processing models defined in terms<br />
of any matrix decomposition of the acquired data, not just<br />
the eigen-decomposition typical in the six-direction tensor<br />
acquisitions. Also, there is a spatial resolution tradeoff<br />
between the need for high resolution to observe subtle white<br />
matter pathways and the acquisition time available for the<br />
subjects. These processing tools will be helpful to extend<br />
the limits of SNR in the extraction of meaningful anatomic<br />
information. An additional area of potential impact for a<br />
tool such as this includes utilizing tensor information in<br />
solving for neural systems-based functional imaging. [47]-<br />
[49] It might be remarked that the focus of the reported<br />
work is the model-based optimal extraction of information<br />
for a given SNR and DTI data acquisition parameters, and<br />
future work remains necessary for optimization involving<br />
SNR and data acquisition parameters.<br />
We note that the simultaneous smoothing and segmentation<br />
process can change the nature of the error in the<br />
smoothed estimates and the use of smoothed estimates for<br />
further analysis, such as for group analysis, which may need<br />
to employ alternate analysis approaches that are not necessarily<br />
based on a specific noise model assumption such as<br />
Gaussian noise. For example, for decision support, methods<br />
such as support vector machines can be employed.<br />
In addition, the method’s appeal is the flexibility to use<br />
various lower dimensional attributes of the higher dimensional<br />
data using functions F and H, and we demonstrate<br />
this strength here primarily in the context of 2D data. The<br />
method, however, can be readily applied to 3D data. In the<br />
Model-Based Variational Smoothing and Segmentation for Diffusion Tensor Imaging in the Brain 65
case of 3D analysis, additional terms associated with gradients<br />
of the data and edge fields in the added third dimension<br />
arise in the energy functional E of (2). We, therefore, have<br />
edge surfaces in 3D that are smoother than those obtainable<br />
from edge boundaries produced by the 2D analysis.<br />
To conclude, we have presented a general framework for<br />
smoothing diffusion tensor data and have developed a tool<br />
to execute this processing. The preferred choice of the fidelity<br />
and continuity functions h1 (u), h2 (g) and f(u) generally<br />
will depend on both the image and the objective of the<br />
image analysis task. There is no universal image model that<br />
outperforms all others in all situations. Moreover, different<br />
regions of the data domain require segmentations based<br />
on more than one model. An important objective in this<br />
study is, therefore, to identify for DTI data a small number<br />
of potent models that can be adapted for effective segmentation.<br />
Further, as no single model applies over the entire<br />
image due to variations in the underlying tissue and partial<br />
volume effects, adaptive learning of relevant features at<br />
every voxel based on neighborhood characteristics is another<br />
focus of ongoing research. The improved output data will<br />
enable a more refined analysis, including segmentation of<br />
white matter substructures using various manual and automated<br />
techniques.<br />
acknowledgment<br />
This work supported by PHS Research Grant no. 2 R01<br />
NS34189 from the National Institute of Neurological Disorders<br />
and Stroke (NINDS), National Cancer Institute (NCI)<br />
and National Institute of Mental Health (NIMH), as part of<br />
the Human Brain Project, and a <strong>Draper</strong> <strong>Laboratory</strong> R&D<br />
project. We also acknowledge Van Wedeen and David Tuch<br />
for helpful discussions and visualization tools.<br />
references<br />
[1] Mori, S. and P.B. Barker, “Diffusion Magnetic Resonance Imaging:<br />
Its Principle and Applications,” Anat. Rec., Vol. 257,<br />
No. 3, 1999, pp. 102-109.<br />
[2] Le Bihan, D., J.F. Mangin, C. Poupon, C.A Clark, S. Pappata,<br />
N. Molko, H. Chabriat, “Diffusion Tensor Imaging: Concepts<br />
and Applications,” J. Magn. Reson. Imaging, Vol. 13, No. 4,<br />
2001, pp. 534-546.<br />
[3] Parker, G.J. “Analysis of MR Diffusion Weighted Images,” Br.<br />
J. Radiol. 77 Spec. No 2: S176-85, 2004.<br />
[4] Pierpaoli, C., A. Righini, I. Linfante, J.H. Tao-Cheng, J.R. Alger,<br />
G. Di Chiro, “Histopathologic Correlates of Abnormal<br />
Water Diffusion in Cerebral Ischemia: Diffusion-Weighted<br />
MR Imaging and Light and Electron Microscopic Study,” Radiology,<br />
Vol. 189, No. 2, 1993, pp. 439-448.<br />
[5] Hossmann, K.A., M. Fischer, K. Bockhorst, M. Hoehn-Berlage,<br />
“NMR Imaging of the Apparent Diffusion Coefficient<br />
(ADC) for the Evaluation of Metabolic Suppression and Recovery<br />
after Prolonged Cerebral Ischemia,” J. Cereb. Blood<br />
Flow Metab., Vol.14, No. 5, 1994, pp. 723-731.<br />
[6] Sorensen, A.G., F.S. Buonano, R.G. Gonzalez, L.H Schwamm,<br />
M.H. Lev, F.R. Huang-Hellinger, T.G. Reese, R.M. Weisskoff,<br />
T.L. Davis, N. Suwanwela, U. Can, J.A. Moreira, W.A. Copen,<br />
R.B. Look, S.P. Finkelstein, B.R. Rosen, W.J. Koroshetz,<br />
66 Model-Based Variational Smoothing and Segmentation for Diffusion Tensor Imaging in the Brain<br />
“Hyperacute Stroke: Evaluation with Combined Multisection<br />
Diffusion-Weighted and Hemodynamically Weighted Echo-<br />
Planar MR Imaging,” Radiology, Vol. 199, No. 2, 1996, pp.<br />
391-401.<br />
[7] Sorensen, A.G., O. Wu, W.A. Copen, T.L. Davis, R.G. Gonzalez,<br />
W.J. Koroshetz, T.G. Reese, B.R. Rosen, V.J. Wedeen,<br />
R.M. Weisskoff, “Human Acute Cerebral Ischemia: Detection<br />
of Changes in Water Diffusion Anisotropy by Using MR Imaging,”<br />
Radiology, Vol. 212, No. 3, 1999, pp. 785-792.<br />
[8] Lim, K.O., M. Hedehus, M. Moseley, A. de Crespigny, E.V.<br />
Sullivan, A. Pfefferbaum, “Compromised White Matter Tract<br />
Integrity in Schizophrenia Inferred from Diffusion Tensor<br />
Imaging,” Arch. Gen. Psychiatry, Vol. 56, No. 4, 1999, pp.<br />
367-374.<br />
[9] Klingberg, T., M. Hedehus, E. Temple, T. Salz, J.D. Gabrieli,<br />
M.E. Moseley, R.A. Poldrack, “Microstructure of Temporo-<br />
Parietal White Matter as a Basis for Reading Ability: Evidence<br />
from Diffusion Tensor Magnetic Resonance Imaging,” Neuron.,<br />
Vol. 25, No. 2, 2000, pp. 493-500.<br />
[10] Meyer, J.R., A. Gutierrez, B. Mock, D. Hebron, J.M. Prager,<br />
M.T. Gorey, D. Homer, “High-b-Value Diffusion-Weighted<br />
MR Imaging of Suspected Brain Infarction,” AJNR Am. J.<br />
Neuroradiol., Vol. 21, No. 10, 2000, pp. 1821-1829.<br />
[11] Pfefferbaum, A., E.V. Sullivan, M. Hedehus, K.O. Lim, E.<br />
Adalsteinsson, M. Moseley, “Age-Related Decline in Brain<br />
White Matter Anisotropy Measured with Spatially Corrected<br />
Echo-Planar Diffusion Tensor Imaging,” Magn. Reson. Med.,<br />
Vol. 44, No. 2, 2000, pp. 259-268.<br />
[12] Wiegell, M.R., H.B. Larsson, V.J. Wedeen, “Fiber Crossing in<br />
Human Brain Depicted with Diffusion Tensor MR Imaging,”<br />
Radiology, Vol. 21, No. 3, 2000, pp. 897-903.<br />
[13] Beaulieu, C., “The Basis of Anisotropic Water Diffusion in<br />
the Nervous System, a Technical Review,” NMR Biomed.,<br />
Vol. 15, 2002, pp. 435-455.<br />
[14] Makris, N., A.J. Worth, A.G. Sorensen, G.M. Papadimitriou,<br />
O. Wu, T.G. Reese, V.J. Wedeen, T.L. Davis, J.W. Stakes, V.S.<br />
Caviness, E. Kaplan, B.R. Rosen, D.N. Pandya, D.N. Kennedy,<br />
“Morphometry of In Vivo Human White Matter Association<br />
Pathways with Diffusion-Weighted Magnetic Resonance<br />
Imaging,” Ann. Neurol., Vol. 42, No. 6, 1997, pp. 951-962.<br />
[15] Poupon, C., J.F. Mangin, V. Frouin, J. Regis, F. Poupon, M.<br />
Pachot-Clouard, D. LeBihan, I. Bloch, “Regularization of<br />
MR Diffusion Tensor Maps for Tracking Brain White Matter<br />
Bundles,” Proceedings of MICCAI’98, 1998, pp. 489-498.<br />
[16] Conturo, T.E., N.F. Lori, T.S. Cull, E. Akbudak, A.Z. Snyder,<br />
J.S. Shimony, R.C. McKinstry, H. Burton, M.E. Raichle,<br />
“Tracking Neuronal Fiber Pathways in the Living Human<br />
Brain,” Proc. Natl. Acad. Sci. USA, Vol. 96, No. 18, 1999,<br />
pp. 10422-10427.<br />
[17] Mori, S., B.J. Crain, V.P. Chacko, P.C. van Zijl, “Three-Dimensional<br />
Tracking of Axonal Projections in the Brain by<br />
Magnetic Resonance Imaging,” Ann. Neurol., Vol. 45, No. 2,<br />
1999, pp. 265-269.<br />
[18] Basser, P.J., S. Pajevic, C. Pierpaoli, J. Duda, A. Aldroubi, “In<br />
Vivo Fiber Tractography Using DT-MRI Data,” Magn. Reson.<br />
Med., Vol. 44, No. 4, 2000, pp. 625-632.<br />
[19] Zhang, S., C. Curry, D.S. Morris, D.H. Laidlaw, “Visualizing<br />
Diffusion Tensor MR Images Using Streamtubes and Streamsurfaces,”<br />
Proceedings of the IEEE Visualization Conference,<br />
Utah, 2000.
[20] Pierpaoli, C., A. Barnett, S. Pajevic, R. Chen, L.R. Penix, A.<br />
Virta, P. Basser, “Water Diffusion Changes in Wallerian Degeneration<br />
and Their Dependence on White Matter Architecture,”<br />
Neuroimage, Vol. 13, No. 6, Pt. 1, 2001, pp. 1174-<br />
1185.<br />
[21] Poupon, C., J. Mangin, C.A. Clark, V. Frouin, J. Regis, D. Le<br />
Bihan, I. Bloch, “Towards Inference of Human Brain Connectivity<br />
from MR Diffusion Tensor Data,” Med. Image Anal.,<br />
Vol. 5, No. 1, 2001, pp. 1-15.<br />
[22] Stieltjes, B., W.E. Kaufmann, P.C. van Zijl, K. Fredericksen,<br />
G.D. Pearlson, M. Solaiyappan, S. Mori, “Diffusion Tensor<br />
Imaging and Axonal Tracking in the Human Brainstem,”<br />
Neuroimage, Vol. 14, No. 3, 2001, pp. 723-735.<br />
[23] Grimm, C.M., J.J. Crisco, D.H. Laidlaw, “Fitting Manifold<br />
Surfaces to Three-Dimensional Point Clouds,” J. Biomech.<br />
Eng., Vol. 124, No. 1, 2002, pp. 136-140.<br />
[24] Mori, S., W.E. Kaufmann, C. Davatzikos, B. Stieltjes, L. Amodei,<br />
K. Fredericksen, G.D. Pearlson, E.R. Melhem, M. Solaiyappan,<br />
G.V. Raymond, H.W. Moser, P.C. van Zijl, “Imaging<br />
Cortical Association Tracts in the Human Brain Using Diffusion-Tensor-Based<br />
Axonal Tracking,” Magn. Reson. Med.,<br />
Vol. 47, No. 2, 2002, pp. 215-223.<br />
[25] Darquie, A., J.B. Poline, C. Poupon, H. Saint-Jalmes, D. Le<br />
Bihan, “Transient Decrease in Water Diffusion Observed in<br />
Human Occipital Cortex During Visual Stimulation,” Proc.<br />
Natl. Acad. Sci. USA, Vol. 98, No. 16, 2001, pp. 9391-<br />
9395.<br />
[26] Vermuri, B.C., Y. Chen, M. Rao, T. McGraw, Z. Wang, T.<br />
Mareci, “Fiber Tract Mapping from Diffusion Tensor MRI,”<br />
Proceedings of the IEEE Workshop on Variational Level Set<br />
Methods in Computer Vision, 2001, pp. 81-88.<br />
[27] Parker, G.J.M., C.A.M. Wheeler-Kingshott, G.J. Barker, “Estimating<br />
Distributed Anatomical Connectivity Using Fast<br />
Marching Methods and Diffusion Tensor Imaging,” IEEE<br />
Trans. On Med. Imaging, Vol. 21, No. 5, 2002, pp. 505-<br />
512.<br />
[28] Pajevic, S., A. Aldroubi, P.J. Basser, “A Continuous Tensor<br />
Field Approximation of Discrete DT-MRI Data for Extracting<br />
Microstructural and Architectural Features of Tissue,” J.<br />
Magn. Reson., Vol. 154, No. 1, 2002, pp. 85-100.<br />
[29] Basser, P.J. and C. Pierpaoli, “Microstructural and Physiological<br />
Features of Tissues Elucidated by Quantitative-Diffusion-<br />
Tensor MRI,” J. Magn. Reson. B, Vol. 111, 3, 1996, pp. 209-<br />
219.<br />
[30] Ambrosio L. and V.M. Tortorelli, “On Approximation of<br />
Functionals Depending on Jumps by Quadratic Elliptic<br />
Functionals,” Boll. Un. Mat. Ital., Vol. 6-B, 1992, pp. 105-<br />
123.<br />
[31] Mumford, D. and J. Shah, “Boundary Detection by Minimizing<br />
Functionals,” Proc. of IEEE Conference on Computer Vision<br />
and Pattern Recognition, 1985, pp. 22-26.<br />
[32] Mumford, D. and J. Shah, “Optimal Approximations by<br />
Piecewise Smooth Functions and Associated Variational<br />
Problems,” Communications on Pure and Applied Mathematics,<br />
Vol. XLII, No. 5, 1989, pp. 577-684.<br />
[33] Shah, J., “A Common Framework for Curve Evolution, Segmentation<br />
and Anisotropic Diffusion,” Proc. IEEE Conference<br />
on Computer Vision and Pattern Recognition, 1996, pp.<br />
136-142.<br />
[34] Pien, H., M. Desai, J. Shah, “Segmentation of MR Images Using<br />
Curve Evolution and Prior Information,” Int’l J. Pattern<br />
Recognition and Artificial Intelligence, Vol. 11, No. 8, 1997,<br />
pp. 1233-1245.<br />
[35] Desai, M., R. Mangoubi, J. Shah, W. Karl, D.N. Kennedy, H.<br />
Pien, A. Worth, “Functional MRI Activity Characterization<br />
Using Robust Non-Gaussian Detection and Curve Evolution,”<br />
IEEE Trans. Med. Imag., Vol. 21, No. 11, 2002, pp.<br />
1402-1412.<br />
[36] Kogan, R., M. Desai, H. Pien, “Model-Based Visualization of<br />
Ultrasound Images,” AeroSense ’99 Battlefield Biomedical<br />
Technologies Conference, Orlando, FL, 1999.<br />
[37] Hasan, K.M., P.J. Basser, D.L. Parker, A.L. Alexander, “Analytical<br />
Computation of the Eigenvalues and Eigenvectors in<br />
DT-MRI,” J. Magn. Reson., Vol. 152, No. 1, 2001, pp. 41-<br />
47.<br />
[38] Pajevic, S. and C. Pierpaoli, “Color Schemes to Represent<br />
the Orientation of Anisotropic Tissues from Diffusion Tensor<br />
Data: Application to White Matter Fiber Tract Mapping in<br />
the Human Brain,” Magn. Reson. Med., Vol. 43, No. 6, 2000,<br />
pp. 921.<br />
[39] Szeszko, P.R., B.A. Ardekani, M. Ashtari, A.K. Malhotra, D.G.<br />
Robinson, R.M. Bilder, K.O. Lim, “White Matter Abnormalities<br />
in Obsessive-Compulsive Disorder: a Diffusion Tensor<br />
Imaging Study,” Arch. Gen. Psychiatry, Vol. 62, No. 7, 2005,<br />
782-90.<br />
[40] Makris, N., D.N. Kennedy, S. McInerney, A.G. Sorensen,<br />
R. Wang, V.S. Caviness, Jr., D.N. Pandya, “Segmentation of<br />
Subcomponents Within the Superior Longitudinal Fascicle<br />
in Humans: A Quantitative, In Vivo, DT-MRI Study,” Cereb.<br />
Cortex, Vol. 15, No. 6, 2005, pp. 854-69.<br />
[41] Johansen-Berg, H., T.E. Behrens, E. Sillery, O. Ciccarelli,<br />
A.J. Thompson, S.M. Smith, P.M. Matthews, “Functional-<br />
Anatomical Validation and Individual Variation of Diffusion<br />
Tractography-Based Segmentation of the Human Thalamus,”<br />
Cereb. Cortex, Vol. 15, No. 1, 2005, pp. 31-39.<br />
[42] Jones, D.K. and C. Pierpaoli, “Confidence Mapping in Diffusion<br />
Tensor Magnetic Resonance Imaging Tractography Using<br />
a Bootstrap Approach,” Magn. Reson. Med., Vol. 53, No.<br />
5, 2005, pp. 1143-1149.<br />
[43] Kang, N., J. Zhang, E.S. Carlson, D. Gembris, “White Matter<br />
Fiber Tractography via Anisotropic Diffusion Simulation in<br />
the Human Brain,” IEEE Trans. Med. Imaging, Vol. 24, No.<br />
9, 2005, pp. 1127-37.<br />
[44] Tuch, D.S., T.G. Reese, M.R. Wiegell, N. Makris, J.W. Belliveau,<br />
V.J. Wedeen, “High Angular Resolution Diffusion Imaging<br />
Reveals Intravoxel White Matter Fiber Heterogeneity,”<br />
Magn. Reson. Med., Vol. 48, No. 4, 2002, pp. 577-582.<br />
[45] Jones, D.K., “The Effect of Gradient Sampling Schemes on<br />
Measures Derived from Diffusion Tensor MRI: a Monte Carlo<br />
Study,” Magn. Reson. Med., 2004, Vol. 51, No. 4, pp. 807-<br />
15.<br />
[46] Frank, L.R., “Anisotropy in High Angular Resolution Diffusion-Weighted<br />
MRI,” Magn. Reson. Med., Vol. 45, No. 6,<br />
2001, pp. 935-939.<br />
[47] Buchel, C., “Perspectives on the Estimation of Effective Connectivity<br />
from Neuroimaging Data,” Neuroinformatics, Vol.<br />
2, No. 2, 2004, pp. 169-174.<br />
Model-Based Variational Smoothing and Segmentation for Diffusion Tensor Imaging in the Brain 67
[48] McIntosh, A.R., “Contexts and Catalysts: A Resolution of the<br />
Localization and Integration of Function in the Brain,” Neuroinformatics,<br />
Vol. 2, 2, 2004, pp. 175-82.<br />
[49] Valdes-Sosa, P.A., “Spatio-Temporal Autoregressive Models<br />
Defined over Brain Manifolds,” Neuroinformatics, Vol. 2, No.<br />
2, 2004, pp. 239-250.<br />
[50] Basser, P.J., J. Mattiello, D. Le Bihan, “Estimation of the Effective<br />
Self-Diffusion Tensor from the NMR Spin Echo,” Journal<br />
of Magnetic Resonance, Series B, Vol. 103, 1994, pp. 247-<br />
254.<br />
[51] Basser, P.J. and C. Pierpaoli, “A Simplified Method to Measure<br />
the Diffusion Tensor from Seven MR Images,” Magn.<br />
Reson. Med., Vol. 39, No. 6, 1998, pp. 928-934.<br />
[52] Le Bihan, D., E. Breton, D. Lallemand, P. Grenier, E. Cabanis,<br />
M. Laval-Jeantet, “MR Imaging of Intravoxel Incoherent Motions:<br />
Applications to Diffusion and Perfusion in Neurologic<br />
Disorders,” Radiology, Vol. 161, 1986, pp. 401-407.<br />
[53] Mattiello, J., P.J. Basser, D. Le Bihan, “The b Matrix in Diffusion<br />
Tensor Echo-Planar Imaging,” Magn. Reson. Med., Vol.<br />
37, No. 2, 1997, pp. 292-300.<br />
[54] Moseley, M.E., Y. Cohen, J. Kucharczyk, J. Mintorovitch,<br />
H.S. Asgari, M.R. Wendland, J. Tsuruda, D. Norman, “Diffusion-Weighted<br />
MR Imaging of Anisotropic Water Diffusion<br />
in Cat Central Nervous System,” Radiology, Vol. 176, 1990<br />
pp. 439-446.<br />
[55] Pierpaoli, C., P. Jezzard, P.J. Basser, A. Barnett, G. Di Chiro,<br />
“Diffusion Tensor MR Imaging of the Human Brain,” Radiology,<br />
Vol. 201, No. 3, 1996, pp. 637-648.<br />
[56] Stejskal, E.O. and J.E. Tanner, “Diffusion Measurements:<br />
Spin Echoes in the Presence of a Time-Dependent Field Gradient,”<br />
J. Chem. Phys., Vol. 42, No. 1, 1965, pp. 288-292.<br />
[57] Turner, R.; D. Le Bihan, J. Maier, R. Vavrek, L.K. Hedges, J.<br />
Pekar, “Echo-Planar Imaging of Intravoxel Incoherent Motion,”<br />
Radiology, Vol. 177, No. 2, 1990, pp. 407-414.<br />
68 Model-Based Variational Smoothing and Segmentation for Diffusion Tensor Imaging in the Brain
(l-r) Mukund N. Desai and<br />
Rami S. Mangoubi<br />
bios<br />
Mukund Desai is a Distinguished Member of the Technical Staff at<br />
<strong>Draper</strong> <strong>Laboratory</strong>. He has led research in optimal control, planning,<br />
estimation, optimal and robust detection, and image processing.<br />
His research work found novel applications at <strong>Draper</strong> in aircraft<br />
flight path management, path planning, battlefield management,<br />
mine hunting, target tracking, and distributed sensing. He holds<br />
two patents for helicopter swash-plate control and for finite capacity<br />
interaction processes. He has three more patents under filing. He<br />
has numerous technical publications, including two book chapters.<br />
Current research activities include the development of robust non-<br />
Gaussian and nonlinear signal modeling, learning, and detection,<br />
with application to chemical sensing, image and signal processing. His current work in multidimensional estimation has been<br />
applied to simultaneous denoising and segmentation of structural, functional magnetic resonance images and diffusion tensor<br />
images. He is also interested in ad hoc communication between distributed sensors, with application to the detection of transient<br />
phenomena. He also supervises graduate students conducting their research at <strong>Draper</strong>. He received BS and MS degrees<br />
with distinction from the Indian Institute of Science (IISc), Bangalore, India, and a PhD in Applied Mathematics from Harvard<br />
University.<br />
David N. Kennedy is an Associate Professor of Neurology at the Harvard Medical School, and jointly appointed in the Neurology<br />
and Radiology Departments at the MGH. He has extensive expertise in the development of image analysis techniques<br />
and co-founded the Center for Morphometric Analysis at MGH. He has participated in the advent of such technologies as<br />
MRI-based morphometric analysis (1989), functional MRI (1991), and diffusion tensor pathway analysis (1998). He has longstanding<br />
experience with the development of neuroinformatics resources (Internet Brain Volumetric Database, Internet Brain<br />
Segmentation Repository, Internet Analysis Tools Registry), is co-Principal Investigator of the morphometry Biomedical Informatics<br />
Research Network (mBIRN), has been a Human Brain Project grant recipient since 1996, and is a founding editor of<br />
Neuroinformatics, which debuted in 2003.<br />
Rami Mangoubi is a Senior Member of the Technical Staff at <strong>Draper</strong> <strong>Laboratory</strong>. He has worked on problems and led projects<br />
in operations research, control, alignment and calibration, and statistical signal detection, with a wide range of applications<br />
including computer networks, control of and failure detection in autonomous and space vehicles, biochemical sensing,<br />
magnetic resonance brain imaging and components mathematical model development and validation. Earlier in his career, he<br />
introduced the use of robust game theoretic filters for failure detection in dynamic plants. Current research includes robust non-<br />
Gaussian signal detection and cellular imaging. His numerous publications include Robust Estimation and Failure Detection: A<br />
Concise Treatment (Springer Verlag, London, UK, 1998). He supervises graduate students conducting their research at <strong>Draper</strong>.<br />
Dr. Mangoubi was an invited plenary speaker for the 2000 International Federation of Automatic Control’s (IFAC) SAFEPRO-<br />
CESS conference in Budapest, Hungary. He is currently a principal investigator on an NIH research grant in the area of cellular<br />
imaging. He is a member of the IFAC SAFEPROCESS Technical Committee and a senior member of AIAA. He received a BS in<br />
Mechanical Engineering, an MS in Operations Research, and a PhD in Detection, Estimation, and Control from MIT.<br />
Model-Based Variational Smoothing and Segmentation for Diffusion Tensor Imaging in the Brain 69
70 2006 Published Papers<br />
published<br />
2006<br />
Papers<br />
Aceti, J.; Bernstein, J.; Borenstein, J.T.; Clark, H.A.;<br />
Zapata, A.M.<br />
Engineering Solutions to Problems of National<br />
Significance: Applying Biomedical Engineering Technologies<br />
to Healthcare Needs<br />
Explorations, The Charles Stark <strong>Draper</strong> <strong>Laboratory</strong>, Inc.,<br />
Fall 2006<br />
Abramson, M.R.; Carter, D.W.; Collins, B.K.;<br />
Kolitz, S.E.; Miller, J.V.; Scheidler, P.J.; Strauss, C.M.<br />
Operational Use of EPOS to Increase the Science<br />
Value of EO-1 Observation Data<br />
6 th Earth Science Technology Conference (ESTC), Baltimore,<br />
MD, June 26-29, 2006. Sponsored by: NASA’s<br />
Earth-Sun Systems Technology Office (ESTO)<br />
Armstrong, J.T.; Mozurkewich, D.; Hajian, A.R.;<br />
Johnston, K.J.; Thessin, R.N.; Peterson, D.M.;<br />
Hummel, C.A.; Gilbreath, G.C.<br />
The Hyades Binary Theta Squared Tauri: Confronting<br />
Evolutionary Models with Optical Interferometry<br />
Astronomical Journal, Vol. 131, No. 5, May 2006<br />
Benson, D.A.; Rao, A.V.; Huntington, G.T.;<br />
Thorvaldsen, T. P.<br />
Direct Trajectory Optimization and Costate Estimation<br />
via a Gauss Pseudospectral Method<br />
AIAA Guidance, Navigation, and Control Conference,<br />
Keystone, CO, August 21-24, 2006<br />
Bernstein, J.J.; Lee, T.W.; Rogomentich, F.J.;<br />
Bancu, M.G.; Kim, K.H.; Maguluri, G.; Bouma,<br />
B.E.; DeBoer, J.F.<br />
Magnetic Two-Axis Micromirror for 3D OCT<br />
Endoscopy<br />
2006 Solid State Sensors, Actuators, and Microsystems<br />
Workshop, Hilton Head, SC, June 4-8, 2006, pp. 7-10<br />
Bettinger, C.J.; Orrick, B.; Misra, A.; Langer, R.;<br />
Borenstein, J.T.<br />
Microfabrication of Poly (Glycerol-Sebacate) for<br />
Contact Guidance Applications<br />
Biomaterials, Elsevier, Vol. 27, No. 12, April 2006, pp.<br />
2558-2565<br />
Bettinger, C.J.; Weinberg, E.J.; Kulig, K.M.;<br />
Vacanti, J.P.; Wang, Y.; Borenstein, J.T.; Langer, R.<br />
Three-Dimensional Microfluidic Tissue-Engineering<br />
Scaffolds Using a Flexible Biodegradable Polymer<br />
Advanced Materials, Vol. 18, No. 2, January 19, 2006,<br />
pp. 165-169<br />
Bickford, J.A.<br />
Extraction of Antiparticles Concentrated in Planetary<br />
Magnetic Fields. Phase I Study<br />
NASA Institute for Advanced Concepts (NIAC) Fellows<br />
Meeting, March 8, 2006, Atlanta, GA<br />
Bickford, J.; Schmitt, W.M.; Spjeldvik, W.N.;<br />
Gusev, A.; Pugacheva, G.I.; Martin, I.<br />
Natural Sources of Antiparticles in the Solar System<br />
and the Feasibility of Extraction for High Delta-V<br />
Space Propulsion<br />
New Trends in Astrodynamics and Applications, III,<br />
Princeton, NJ, August 16-18, 2006. Sponsored by:<br />
American Institute of Physics (AIP)<br />
Borenstein, J.T.<br />
The Role of Engineering in Advancing Health Care<br />
in the 21 st Century<br />
Presentation posted on Wentworth Institute of Technology’s<br />
web site<br />
Candler, R.N.; Duwel, A.; Varghese, M.;<br />
Chandorkar, S.; Hopcroft, M.; Park, W.T.; Kim, B.;<br />
Yama, G.; Partridge, A.; Lutz, M.; Kenny, T.W.<br />
Impact of Geometry on Thermoelastic Dissipation in<br />
Micromechanical Resonant Beams<br />
IEEE JMEMS, Vol. 15, No. 927, 2006<br />
Carlen, E.T.; Weinberg, M.S.; Dube, C.E;<br />
Zapata, A.M.; Borenstein, J.T.<br />
Micromachined Silicon Plates for Sensing Molecular<br />
Interactions<br />
Applied Physics Letters, AIP, Vol. 89, No. 17, October<br />
23, 2006
Cernosek, R.W.; Robinson, A.L.; Cruz, D.Y;<br />
Adkins, D.R.; Barnett, J.L.; Bauer, J.M.; Blain, M.G.;<br />
Byrnes, J.E.; Dirk, S.M.; Dulleck, G.R.; Ellison, J.A.;<br />
Fleming, J.G.; Hamilton, T.W.; Heller, E.J.;<br />
Howell, S.W.; Kottenstette, R.J.; Lewis, P.R.;<br />
Manginell, R.P.; Moorman, M.W.; Mowry, C.D.;<br />
Manley, R.G.; Okandan, M.; Rahimian, K.;<br />
Shelmidine, G.J.; Shul, R.J.; Simonson, R.J.;<br />
Sokolowski, S.S.; Spates, J.J.; Staton, A.W.;<br />
Trudell, D.E.; Wheeler, D.R.; Yelton, W.G.; Eds.:<br />
Thomas, G.; Zhong-Yang, C.<br />
Micro-Analytical Systems for National Security<br />
Applications<br />
Micro (MEMS) and Nanotechnologies for Space Applications,<br />
April 19-20, 2006, Kissimmee, Florida<br />
Chen, D.; Lin, P.J.<br />
Minimum Energy Path Planning for Ad Hoc<br />
Networks<br />
Wireless Communications and Networking Conference<br />
(WCNC), Las Vegas, NV, April 3-6, 2006. Sponsored by:<br />
IEEE<br />
Davis, C.E.; Krebs, M.D.; Tingley, R.D.;<br />
Zeskind, J.E.; Holmboe, M.E.; Kang, J.-M.<br />
Alignment of Gas Chromatography-Mass Spectrometry<br />
Data by Landmark Selection from Complex<br />
Chemical Mixtures<br />
Chemometrics and Intelligent <strong>Laboratory</strong> Systems, Vol.<br />
81, No.1, March 2006, pp. 74-81<br />
Desai, M.N.; Kennedy, D.N.; Mangoubi, R.S.;<br />
Shah, J.; Karl, C.; Worth, A.; Makris, N.; Pien, H.<br />
Model-Based Variational Smoothing and Segmentation<br />
for Diffusion Tensor Imaging in the Brain<br />
Neuroinformatics, Vol. 4, No. 3, 2006, pp. 217-234<br />
Desai, M.N.; Mangoubi, R.S.; Kennedy, D.<br />
Robust Constrained Non-Gaussian fMRI Detection<br />
International Symposium on Biomedical Imaging from<br />
Nano to Macro, Arlington, VA, April 6-9, 2006. Sponsored<br />
by: IEEE<br />
Dever, C.; Mettler, B.; Feron, E.; Popovic, J.;<br />
McConley, M.<br />
Nonlinear Trajectory Generation for Autonomous<br />
Vehicles Via Parameterized Maneuver Classes<br />
Journal of Guidance Control and Dynamics, Vol. 29, No.<br />
2, March-April 2006, pp. 289-302<br />
Duwel, A.E.; Candler, R.N.; Kenny, T.W.;<br />
Varghese, M.<br />
Engineering MEMS Resonators with Low Thermoelastic<br />
Damping<br />
Journal of Microelectromechanical Systems, IEEE, Vol.<br />
15, No. 6, December 2006, pp. 1437-1445<br />
Fucetola, C.; Carter, D.J.<br />
Process Latitude of Deep-Ultraviolet Conformable<br />
Contact Photolithography<br />
50 th International Conference on Electron, Ion, and<br />
Photon Beam Technology and Nanofabrication, Baltimore,<br />
MD, May 30-June 2, 2006<br />
Fuhrman, L.R.<br />
Future of Lunar Landing Systems<br />
29 th Rocky Mountain Guidance and Control Conference,<br />
Breckenridge, CO, February 4-8, 2006, Advances<br />
in the Astronautical Sciences, Vol. 125, 2006, pp.<br />
213-223. Sponsored by: American Astronautical Society<br />
(AAS)<br />
Gustafson, D.E.; Elwell Jr., J.M.; Soltz, J.A.<br />
Innovative Indoor Geolocation Using RF Multipath<br />
Diversity<br />
Position Location and Navigation Symposium (PLANS),<br />
San Diego, CA, April 25-27, 2006. Sponsored by<br />
IEEE/ION<br />
Harjes, D.I.; Clark, H.A.<br />
Novel Optical Biosensor Arrays for Toxicity Screening<br />
in Drug Discovery<br />
57 th Pittsburgh Conference on Analytical Chemistry and<br />
Applied Spectroscopy (PITTCON), Orlando, FL, March<br />
12-17, 2006<br />
Hattis, P.D.; Campbell, D.P.; Carter, D.W.;<br />
McConley, M.; Tavan, S.<br />
Providing Means for Precision Airdrop Delivery from<br />
High Altitude<br />
AIAA Guidance, Navigation, and Control Conference,<br />
Keystone, CO, August 21-24, 2006<br />
Hawkins, A.M.; Fill, T.J.; Proulx, R.J.; Feron, E.M.J.<br />
Constrained Trajectory Optimization for Lunar<br />
Landing<br />
Spaceflight Mechanics 2006, Tampa, FL, January 22-26,<br />
2006, Advances in the Astronautical Sciences, Part I, Vol.<br />
124, 2006, pp. 815-836<br />
Heinrich, N.; Case, A.; Stein, R.L.; Clark, H.A.<br />
Optical Sensors for the Monitoring of Enzymatic<br />
Reaction for Drug Screening in Neurodegenerative<br />
Disease<br />
57 th Pittsburgh Conference on Analytical Chemistry and<br />
Applied Spectroscopy (PITTCON), Orlando, FL, March<br />
12-17, 2006<br />
Hildebrant, R.<br />
Framework for Autonomy<br />
Optics East, International Symposium, Boston, MA,<br />
October 1-4, 2006. Sponsored by: SPIE<br />
2006 Published Papers 71
72 2006 Published Papers<br />
Hopkins III, R.E.<br />
MEMS Inertial Technology. A Short Course<br />
PLANS, San Diego, CA, April 25-27, 2006. Sponsored<br />
by: IEEE/ION; Joint Navigation Conference (JNC), Las<br />
Vegas, NV, May 1-4, 2006. Sponsored by: Joint Service<br />
Data Exchange (JSDE)<br />
Huntington, G.T.; Rao, A.V.<br />
Optimal Reconfiguration of a Tetrahedral Formation<br />
Via a Gauss Pseudospectral Method<br />
Advances in the Astronautical Sciences, AAS, Vol. 123,<br />
Part II, 2006, pp. 1337-1358<br />
Huntington, G.T.; Benson, D.A.; Rao, A.V.<br />
Post-Optimality Evaluation and Analysis of a Formation<br />
Flying Problem Via a Gauss Pseudospectral<br />
Method<br />
Advances in the Astronautical Sciences - Proceedings of<br />
the AAS/AIAA Astrodynamics Conference, Vol. 123, No.<br />
2, 2006<br />
Jang, J-W.; Fitz-Coy, N.G.<br />
Differential Games: A Pole Placement Approach<br />
Proceedings of the University at Buffalo, State University<br />
of New York/AAS Malcolm D. Shuster Astronautics<br />
Symposium, Grand Island, NY, Vol. 122, 2006<br />
Johnson, M.C.<br />
Parameterized Approach to the Design of Lunar<br />
Lander Attitude Controllers<br />
Guidance, Navigation, and Control Conference,<br />
Keystone, CO, August 21-24, 2006. Sponsored by:<br />
AIAA<br />
Keegan, M.E.; Saltzman, W.M.<br />
Surface-Modified Biodegradable Microspheres for<br />
DNA Vaccine Delivery<br />
Methods in Molecular Medicine, Vol. 127; DNA<br />
Vaccines: Methods and Protocols, 2 nd ed., Humana Press,<br />
2006<br />
Key, R.; Kahn, A.C., Deutsch, O.L.<br />
Midcourse Phase Inventory Management with<br />
Uncertain Threats<br />
Missile Defense Conference & Exhibit, Washington, DC,<br />
March 20-24, 2006. Sponsored by: AIAA<br />
Khademhossini, A.; Bettinger, C.J.; Karp, J.M.;<br />
Yeh, J.; Ling, Y.; Borenstein, J.T.; Fukuda, J.;<br />
Langer, R.<br />
Interplay of Biomaterials and Micro-scale Technologies<br />
for Advancing Biomedical Applications<br />
Journal of Biomaterials Science, Polymer Edition, Vol.<br />
17, No. 11, November 2006<br />
Khademhossini, A.; Langer, R.; Borenstein, J.T.;<br />
Vacanti, J.P.<br />
Microscale Technologies for Tissue Engineering and<br />
Biology<br />
Proceedings of the National Academy of Sciences of the<br />
USA, Vol. 103, No. 8, February 2006<br />
Kondoleon, C.A.; Marinis, T.F.<br />
Package Design for a Miniaturized Capacitive-Based<br />
Chemical Sensor<br />
39 th International Symposium on Microelectronics, San<br />
Diego, CA, October 8-12, 2006. Sponsored by: International<br />
Microelectronics and Packaging Society (IMAPS)<br />
Kourepenis, A.S.; Barbour, N.M.; Hopkins III, R.E.;<br />
Serna, F.J.; Varghese, M.<br />
MEMS Technologies and Applications<br />
International Test and Evaluation Association (ITEA)<br />
Annual Technology Review Conference, Cambridge,<br />
MA, August 8-10, 2006. Sponsored by: ITEA<br />
Krebs, M.D.; Mansfield, B.; Yip, P.; Cohen, S.;<br />
Sonenshein, A.L.; Hitt, B.A..; Davis, C.E.<br />
Novel Technology for Rapid Species-Specific<br />
Detection of Bacillus Spores<br />
Biomolecular Engineering, Vol. 23, February 2006, pp.<br />
119-127<br />
Krebs, M.D.; Kang, J.J.; Cohen, S.; Lozow, J.B.;<br />
Tingley, R.D.; Davis, C.E.<br />
Two-Dimensional Alignment of Differential Mobility<br />
Spectrometer Data<br />
Sensors and Actuators B (Chemical), Vol. 119, No. 2,<br />
December 2006, pp. 475-482<br />
Landis, D.L.; Thorvaldsen, T.P.; Fink, B.J.;<br />
Sherman, P.G.; Holmes, S.M.<br />
Deep Integration Estimator for Urban Ground<br />
Navigation<br />
PLANS, San Diego, CA, April 25-27, 2006. Sponsored<br />
by: IEEE/ION<br />
Lento, C.; McCarragher, B.; Magee, R.<br />
The CERAS Pod Test Cell for Simultaneous Environment<br />
Testing<br />
AIAA Missile Sciences Conference, Monterey, CA,<br />
November 14-16, 2006<br />
Lim, S.Y.; Miotto, P.<br />
Actuator Allocation Algorithm Using Interior Linear<br />
Programming<br />
Guidance, Navigation, and Control Conference,<br />
Keystone, CO, August 21-24, 2006. Sponsored by:<br />
AIAA
Lim, S.Y.<br />
Complementary Roll/Yaw Attitude Controller for<br />
Three-Axis Authority Momentum Spacecraft<br />
Guidance, Navigation, and Control Conference,<br />
Keystone, CO, August 21-24, 2006. Sponsored by:<br />
AIAA<br />
Lymar, D.S.; Neugebauer, T.C.; Perreault, D.J.<br />
Coupled-Magnetic Filters with Adaptive Inductance<br />
Cancellation<br />
IEEE Transactions on Power Electronics, Vol. 21, No. 6,<br />
November 2006, pp. 1529-1540<br />
Marinis, T.F.; Soucy, J.W.; Hanson, D.S.;<br />
Pryputniewicz, R.J.; Marinis, R.T.; Klempner, A.R.<br />
Isolation of MEMS Devices from Package Stresses by<br />
Use of Compliant Metal Interposers<br />
56 th Electronic Components and Technology Conference<br />
(ECTC), San Diego, CA, May 30-June 2, 2006.<br />
Sponsored by: IEEE, Components, Packaging, and<br />
Manufacturing Technology (CPMT) Society<br />
Masterson, R.A.; Miller, D.<br />
Dynamic Tailoring and Tuning of Structurally-<br />
Connected TPF Interferometer<br />
Proceedings of the SPIE, Vol. 6271, July 2006<br />
Masterson, R.A.; Miller, D.<br />
Hardware Tuning for Dynamic Performance Through<br />
Isoperformance Updating<br />
47 th Structures, Structural Dynamics, and Materials<br />
Conference, Newport, RI, May 1-4, 2006. Sponsored<br />
by: AIAA, ASME, American Society of Computer Engineers<br />
(ASCE), American Helicopter Society (AHS), ASC<br />
Mather, R.A.; Matlis, J.<br />
Alternative Approach to Testing Embedded Real-<br />
Time Software<br />
America’s Virtual Product Development (VPD) Conference:<br />
Evolution to Enterprise Simulation, Huntington<br />
Beach, CA, July 17-19, 2006. Sponsored by: MSC<br />
Software<br />
McAlpine, J.; Najjar, R.C.; Thompson, J.<br />
Hazmat Response: Victim Extrication, Trauma<br />
Control, and Decontamination in a <strong>Laboratory</strong><br />
Setting<br />
Proceedings of the 24 th College and University Hazardous<br />
Waste Conference, August 6-9, 2006<br />
McCarragher, B.; Chen, B.; Chamberlin, S.;<br />
Magee, R.<br />
The Simultaneous Application of Vibration, Shock,<br />
and Thermal Missile Environments<br />
AIAA Missile Sciences Conference, Monterey, CA,<br />
November 14-16, 2006<br />
Mettler, B.; Feron, E.; Popovic, J.; McConley, M.<br />
Nonlinear Trajectory Generation for Autonomous<br />
Vehicles via Parameterized Maneuver Classes<br />
Journal of Guidance Control and Dynamics, AIAA, Vol.<br />
29, No. 2, March-April, 2006<br />
Miller, J.W.; Lommel, P.H.<br />
Biomimetic Sensory Abstraction Using Hierarchical<br />
Quilted Self-Organizing Maps<br />
Intelligent Robots and Computer Vision XXIV: Algorithms,<br />
Techniques, and Active Vision, Boston, MA,<br />
October 1-4, 2006. Sponsored by: SPIE<br />
Mitchell, I.T.; Gorton, T.B.; Taskov, K.;<br />
Drews, M.E.; Luckey, D.; Osborne, M.L.;<br />
Page, L.A.; Norris, H.L., III; Shepperd, S.W.<br />
GN&C Development of the XSS-11 Micro-<br />
Satellite for Autonomous Rendezvous and Proximity<br />
Operations<br />
29 th Guidance and Control Conference, Breckenridge,<br />
CO, February 4-8, 2006. Sponsored by: AAS<br />
Neugebauer, T.C.; Perreault, D.J.<br />
Parasitic Capacitance Cancellation in Filter<br />
Inductors<br />
Transactions on Power Electronics, IEEE, Vol. 21, No. 1,<br />
January 2006<br />
Pahlavan, K.; Akgul, F.O.; Heidari, M.;<br />
Hatami, A.; Elwell, J.M.; Tingley, R.D.<br />
Indoor Geolocation in the Absence of Direct Path<br />
IEEE Wireless Communications, Vol. 13, No. 6, December<br />
2006, pp. 50-58<br />
Perry, H.C.; Brady, T.M.; Breton, R.S.; Brodeur, S.J.;<br />
Brown, R.A.; Buckley, S.; Erikson, E.R.;<br />
Fuhrman, L.R.; Jackson, T.R.; Kochocki, J.A.;<br />
Turney, D.J.; Wyman Jr, W.F.<br />
Engineering Solutions to Problems of National<br />
Significance. Embedded Software and <strong>Draper</strong> IDEAS<br />
Explorations, The Charles Stark <strong>Draper</strong> <strong>Laboratory</strong>, Inc.,<br />
Spring 2006<br />
Pierquet, B.J.; Neugebauer, T.C.; Perreault, D.J.<br />
Inductance Compensation of Multiple Capacitors<br />
with Application to Common- and Differential-Mode<br />
Filters<br />
IEEE Transactions on Power Electronics, Vol. 21, No. 6,<br />
November 2006, pp. 1815-1824<br />
Putnam, Z.R.; Braun, R.D.; Bairstow, S.H.;<br />
Barton, G.H.<br />
Improving Lunar Return Entry Footprints Using<br />
Enhanced Skip Trajectory Guidance<br />
Space 2006 Conference, San Jose, CA, September 19-<br />
21, 2006. Sponsored by: AIAA<br />
2006 Published Papers 73
74 2006 Published Papers<br />
Ricard, M.J.; Nervegna, M.F.<br />
Risk-Aware Mixed-Initiative Dynamic Replanning<br />
(RMDR) Program Update<br />
Unmanned Systems North America, Orlando, FL,<br />
August 29-31, 2006. Sponsored by: Association for<br />
Unmanned Vehicle Systems International (AUVSI)<br />
Roth, K.W.; Llana P.; Westphalen D.; Quartararo, L.;<br />
Feng M.Y.<br />
Advanced Controls for Commercial Buildings:<br />
Barriers and Energy Savings Potential<br />
Energy Engineering, 2006, Vol. 103, No. 6, pp. 6-36<br />
Rzepniewski, A.K.; Andrews, G.L.<br />
Legged Robot Motion with Explicit Stability<br />
Constraints: Theory and Application<br />
Unmanned Systems North America, Orlando, FL,<br />
August 29-31, 2006. Sponsored by: AUVSI<br />
Sawyer, W.D.; Prince, M.S<br />
Silicon on Insulator Inertial MEMS Device<br />
Processing<br />
MOEMS-MEMS Micro & Nanofabrication, Photonics<br />
West, San Jose, CA, January 21-26, 2006. Sponsored<br />
by: SPIE<br />
Schmidt, G.T.<br />
Future Navigation Systems: INS/GPS Technology<br />
Trends<br />
The Charles Stark <strong>Draper</strong> <strong>Laboratory</strong>, Inc., 2006<br />
Schmitt, W.M.; Larsen, D.E.; Brown, D.N.;<br />
Harris, Bernard S.; Zuckerman, H.L.<br />
Importance of Secondary Scattering in X-Ray<br />
Transport for Shadowing Analysis<br />
Hardened Electronics and Radiation Technology<br />
(HEART) Conference, Santa Clara, CA, March 6-10,<br />
2006. Sponsored by: Department of Defense (DoD)/<br />
Department of Energy (DoE).<br />
Serklaud, D.K.; Peake, G.M.; Geib, K.M.; Lutwak, R.;<br />
Garvey, R.M.; Varghese, M.; Mescher, M.<br />
VCSELs for Atomic Clocks<br />
Vertical-Cavity Surface-Emitting Lasers X, Proceedings of<br />
SPIE, January 25-26, 2006, San Jose, CA<br />
Springmann, P.; Proulx, R.; Fill, T.<br />
Lunar Descent Using Sequential Engine Shutdown<br />
AIAA/AAS Astrodynamics Specialist Conference and<br />
Exhibit, Keystone, CO, August 21-24, 2006<br />
Stoner, R.; Walsworth, R.<br />
Atomic Physics - Collisions Give Sense of Direction<br />
Nature Physics, Vol. 2 , No. 1, January 2006, pp. 17-18<br />
Stubbs, A.; Vladimerou, V.; Fulford, A.T.; King, D.;<br />
Strick, J.; Dullerud, G.E<br />
Multivehicle Systems Control over Networks<br />
IEEE Control Systems, Vol. 26, No. 3, 2006, pp 56-69<br />
Tawney, J.; Hakimi, F.; Willig, R.L.; Alonzo, J.;<br />
Bise, R.T.; DiMarcello, F.; Monberg, E.M.;<br />
Stockert, T.; Trevor, D.J.<br />
Photonic Crystal Fiber IFOGs<br />
18 th International Conference on Optical Fiber Sensors,<br />
Cancun, Mexico, October 23-27, 2006. Sponsored by:<br />
Optical Society of America (OSA)<br />
Tetewsky, A.; Dow, B.; Bogner, T.; Mitchell, M.;<br />
Daley, S.; Shearer, J.<br />
Evaluating HYGPSIM’s New GPS/INS HWIL Prediction<br />
Capabilities with 2004 Reentry Vehicle Flight<br />
Data<br />
AIAA Missile Science Conference (Classified) Monterey,<br />
CA, November 14-16, 2006<br />
Weinberg, E.J.; Kaazempur-Mofrad, M.R.<br />
Large-Strain Finite-Element Formulation for Biological<br />
Tissues with Application to Mitral Valve Leaflet<br />
Tissue Mechanics<br />
Journal of Biomechanics, Vol. 39, No. 8, 2006, pp.<br />
1557-1561<br />
Weinberg, M.S.; Kourepenis, A.S.<br />
Error Sources in In-Plane Silicon Tuning-Fork MEMS<br />
Gyroscopes<br />
IEEE Journal of Microelectromechanical Systems, Vol.<br />
15, No. 3, June 2006, pp. 479-491<br />
Weinberg, M.S.; Wall, C.; Robertsson, J.;<br />
O’Neil, E.W.; Sienko, K.; Fields, R.P.<br />
Tilt Determination in MEMS Inertial Vestibular<br />
Prosthesis<br />
Journal of Biomechanical Engineering, Transactions<br />
of the ASME, Vol. 128, No. 6, December 2006, pp.<br />
943-56.<br />
Weinberg, M.S.<br />
Tuning Fork MEMS Gyroscopes<br />
Presented at Tufts University, October 12, 2006
Patents<br />
Introduction<br />
<strong>Draper</strong> <strong>Laboratory</strong> is well known for integrating<br />
widely diverse technical capabilities and<br />
technologies into innovative and creative<br />
solutions for problems of national importance.<br />
<strong>Draper</strong>’s scientists and engineers are actively<br />
encouraged to advance the application of science and<br />
technology, to expand the functions of existing technologies,<br />
and to create new ones.<br />
<strong>Draper</strong> has an established patent policy and understands<br />
the value of patents in directing attention to individual<br />
accomplishments. Disclosing inventions is an important<br />
step in documenting these creative efforts and is required<br />
under <strong>Laboratory</strong> contracts and by an agreement with<br />
<strong>Draper</strong> that all employees sign. Pursuing patent protection<br />
enables the <strong>Laboratory</strong> to pursue its strategic mission<br />
and to recognize its employees’ valuable contributions to<br />
advancing the state-of-the-art in their technical areas. An<br />
issued patent is also recognition by a critical third party<br />
(the U.S. Patent Office) of innovative work for which the<br />
inventor should be justly proud.<br />
Through December 31, 2006, 1297 <strong>Draper</strong> patent<br />
disclosures have been submitted to the Patent Committee<br />
since 1973; 655 of those were approved by <strong>Draper</strong>’s<br />
Patent Committee for further patent action. As of<br />
December 31, a total of 4804 patents have been granted<br />
for inventions made by <strong>Draper</strong> personnel. Twelve patents<br />
were issued for calendar year 2006.<br />
This year’s competition for Best Patent resulted in a tie.<br />
The featured patents are:<br />
Multi-gimbaled borehole navigation system<br />
and<br />
Flexural plate wave sensor<br />
The following pages present an overview of the technology<br />
covered in each patent and the official patent<br />
abstracts issued by the U.S. Patent Office.<br />
Patents Introduction 75
Multi-Gimbaled Borehole<br />
Navigation System<br />
Patent # 7,093,370 B2 Date Issued: August 22, 2006<br />
Mitchell L. Hansberry, Michael E. Ash, Richard T. Martorana<br />
76 Multi-Gimbaled Borehole Navigation System<br />
This invention addresses the need to monitor and guide the direction<br />
of a drill bit so that a borehole is created where desired. To determine<br />
the location of a drill bit in a borehole, the position and attitude must<br />
be known, including the vertical orientation and the north direction.<br />
Typically, gyroscopes can be used to determine the north direction, and accelerometers<br />
can be used to determine the vertical orientation. Prior systems have<br />
used single-orientation gyroscopes and/or single orientation accelerometers due<br />
to size limitations. However, these systems can suffer from long-term bias stability<br />
problems.<br />
Many prior systems attempted to determine the drill bit’s location accurately<br />
and efficiently, but each system had limitations. For example, where the internal<br />
diameter of a drill pipe is not large enough to fit the optimal number of typical<br />
navigation sensors, one prior system removed the drill bit from the borehole<br />
and lowered a monitoring tool down the borehole to determine its location.<br />
However, it is costly to stop drilling and spend time removing the drill bit to<br />
take measurements with the monitoring tool. Other systems used single-axis<br />
accelerometers to determine the vertical orientation of the drill bit. However,<br />
an accelerometer system cannot determine north, which is necessary to determine<br />
the full location of a borehole. Another prior design used magnetometers<br />
to determine the magnetic field direction from which the direction of north is<br />
approximated. However, such systems must correct for magnetic interference<br />
and magnetic materials used in the drill pipe and can suffer accuracy degradation<br />
due to the Earth’s changing magnetic field.<br />
This patent describes a novel navigation borehole system that can determine<br />
position and attitude for any orientation in a borehole using multiple gimbals<br />
that contain solid-state or other gyros and accelerometers. The navigation system<br />
includes a housing that can be placed within the smaller diameter drill pipes<br />
used toward the bottom of a borehole, an outer gimbal connected to the housing,<br />
and at least two or more stacked inner gimbals nested in and connected to<br />
the outer gimbal. The inner gimbals each have an axis parallel to one another<br />
and perpendicular to the outer gimbal. The inner gimbals contain electronic<br />
circuits, gyros, and accelerometers whose input axes span three-dimensional<br />
space. The system includes outer and inner gimbal drive systems to maintain<br />
the gyro and accelerometer input axes as substantially orthogonal triads and a<br />
processor that is responsive to the gyro accelerometer circuits to determine the<br />
attitude and the position of the housing in the borehole.<br />
This borehole navigation system can average out navigation errors due to gyro<br />
and accelerometer bias, gyro scale factor, and input-axis alignment errors, and<br />
allows gyro and accelerometer bias and gyro scale-factor calibration as well as<br />
attitude determination during gyrocompassing. This invention also provides<br />
long-term performance accuracy with only short-term requirements on sensor<br />
accuracy, can determine position and attitude while drilling, when the drill<br />
bit is stopped, when the drill bit is inserted or withdrawn, as well as while<br />
logging, both descending and ascending on a log line after the drill bit has been<br />
withdrawn.
Multi-Gimbaled Borehole Navigation System 77
ios<br />
Richard T. Martorana is a Distinguished Member of the Technical<br />
Staff and the Technical Director for the WASP Program. With<br />
over 39 years of research, design, and development experience,<br />
he has directed and managed programs for NASA, USAF, DARPA,<br />
NAVSEA, and others. He was responsible for the thermal design<br />
of the Trident II inertial measurement unit (IMU). His responsibilities<br />
have included: Section Chief for Fluid Mechanics and<br />
Thermal Engineering, Division Manager for Mechanical Design<br />
and Analysis, and Director of Systems Integration, Test, Evaluation,<br />
and Quality Management. He holds three U.S. patents in the areas of mechanical and thermal design. Mr.<br />
Martorana has BS and MS degrees in Mechanical Engineering from Columbia University and MIT, respectively, an<br />
MBA focused on management of innovation from Northeastern University, and he is a graduate of Harvard Business<br />
School’s Program for Management Development.<br />
Mitchell L. Hansberry is a Senior Member of the Technical Staff and a Mechanical Design Engineer with 25 years<br />
experience at <strong>Draper</strong> <strong>Laboratory</strong>. Specializing in the development of hardware configurations to solve system-level<br />
problems, he has been the Lead Mechanical Designer on many projects involving navigation instruments and<br />
systems, space hardware, and biomedical mechanisms. He has a BS in Mechanical Engineering from SUNY at Stony<br />
Brook.<br />
Michael E. Ash was a Principal Member of the Technical Staff in the System Integration, Evaluation, and Test Division,<br />
where he worked on inertial sensor and system modeling, simulation, and testing. Previously, he worked at<br />
the MIT Lincoln <strong>Laboratory</strong> on an interplanetary radar test of general relativity and on-satellite orbit determination.<br />
He was Chair of the Accelerometer Committee of the IEEE/Aerospace Electronics System Society (AESS) Gyro and<br />
Accelerometer Panel and an Associate Fellow of the AIAA. He received a BS from MIT and a PhD from Princeton<br />
University, both in Mathematics.<br />
78 Multi-Gimbaled Borehole Navigation System<br />
(l-r) Mitchell L. Hansberry<br />
and Richard T. Martorana
Flexural Plate Wave Sensor<br />
Patent # 7,109,633 B2 Date Issued: September 19, 2006<br />
Marc S. Weinberg, Brian T. Cunningham, Eric M. Hildebrandt<br />
This patent describes an improved flexural plate wave (FPW) sensor<br />
that includes a thin flexural plate with drive teeth disposed across<br />
its entire length. Further improvements associated with drive combs<br />
of varying tooth length are described. This improved FPW sensor<br />
reduces the number of eigenmodes excited in the flexural plate and outputs a<br />
single pronounced peak or a peak much larger than any of the other peaks and a<br />
distinct phase. This distinct peak simplifies the operating and designing associated<br />
drive and sense electronics and improves stability by eliminating erroneous<br />
readings due to interference created by mode hopping between eigemnodes.<br />
The FPW sensor includes a diaphragm or plate that is driven so that it oscillates<br />
at frequencies determined by a comb pattern and the flexural plate geometry.<br />
The comb pattern is disposed over the flexural plate and establishes electric<br />
fields that interact with the plate’s piezoelectric properties to excite motion.<br />
The eigenmodes describe the diaphragm displacements, which exhibit spatially<br />
distributed peaks. <strong>Each</strong> eigenmode consists of n half sine periods along the<br />
diaphragm’s length. A typical FPW sensor can be excited to eighty or more<br />
eigenmodes. In a typical FPW eigenmode, the plate deflection consists of many<br />
sinusoidal (or nearly sinusoidal) peaks.<br />
Previous flexure plate wave sensor designs typically include drive combs at one<br />
end of the plate and sense combs at the other end. The drive combs of these<br />
devices typically cover only 25% to 40% of the total plate length. When the<br />
number of drive teeth is small compared to the number of eigenmodes peaks,<br />
the small number of drive teeth can align with several eigenmodes. Not only are<br />
the eigenmodes perfectly aligned with the comb teeth excited, but other eigenmodes<br />
are also excited. In signal processing and spectral analysis, this effect is<br />
known as leakage. The increased number of eigenmodes excited in the FPW<br />
sensor produces a series of resonance peaks of similar amplitude and irregular<br />
phase, increasing design complexity and the operation of such FPW sensors.<br />
Other previous FPW designs employ drive and sense combs at opposite ends<br />
of the flexural plate and rely on analysis based on surface acoustic waves (SAW)<br />
where the waves propagate away from the drive combs and toward the sense<br />
combs, and back reflections are regarded as interference. A disadvantage is that<br />
SAW theory does not account for the sensor’s numerous small peaks and the<br />
electronics’ locking onto different eigenmodes depending on noise or starting<br />
conditions.<br />
Bioscale has licensed the FPW technology from <strong>Draper</strong> and will introduce a<br />
commercial product.<br />
Flexural Plate Wave Sensor 79
80 Flexural Plate Wave Sensor
ios<br />
(l-r) Eric M. Hildebrant and<br />
Marc S. Weinberg<br />
Marc S. Weinberg is a <strong>Laboratory</strong> Technical Staff Member at<br />
<strong>Draper</strong> <strong>Laboratory</strong>. He has been responsible for the design and<br />
testing of a wide range of traditional micromechanical gyroscopes,<br />
accelerometers, hydrophones, microphones, angular displacement<br />
sensors, chemical sensors, and biomedical devices. He served in<br />
the United States Air Force at the Aeronautical System Division,<br />
Wright-Patterson Air Force Base during 1974 and 1975, where<br />
he applied modern and classical control theory to design turbine<br />
engine controls, and at the Air Force Institute of Technology, where<br />
he taught gas dynamics and feedback control. He holds 25 patents<br />
with 12 additional in application. He has been a member of ASME<br />
since 1971. Dr. Weinberg received BS (1971), MS (1971), and<br />
PhD (1974) degrees in Mechanical Engineering from MIT where<br />
he held a National Science Foundation Fellowship.<br />
Brian T. Cunningham was a Principal Member of the Technical Staff at <strong>Draper</strong> <strong>Laboratory</strong>. Currently, he is an Associate Professor<br />
of Electrical and Computer Engineering at the University of Illinois at Urbana-Champaign, where he is the Director of<br />
the Nano Sensors Group. His group focuses on the development of photonic crystal-based transducers, plastic-based fabrication<br />
methods, and novel instrumentation approaches for label-free biodetection. He is a founder and the Chief Technical<br />
Officer of SRU Biosystems (Woburn, MA), a life science tools company that provides high sensitivity plastic-based optical<br />
biosensors, instrumentation, and software to the pharmaceutical, academic research, genomics, and proteomics communities.<br />
Prior to founding SRU Biosystems in June 2000, he was the Manager of Biomedical Technology at <strong>Draper</strong> <strong>Laboratory</strong>,<br />
where he directed R&D projects aimed at utilizing defense-related technical capabilities for medical applications. He also<br />
served as Group Leader for MEMS sensors at <strong>Draper</strong>. Concurrently, he was an Associate Director of the Center for Innovative<br />
Minimally Invasive Therapy (CIMIT), a Boston-area medical technology consortium, where he led the Advanced Technology<br />
Team on Microsensors. Before joining <strong>Draper</strong>, he spent 5 years at the Raytheon Electronic Systems Division. Dr. Cunningham<br />
earned BS, MS, and PhD degrees in Electrical and Computer Engineering at the University of Illinois.<br />
Eric M. Hildebrant is a Principal Member of the Technical Staff. Initially, he worked on the MK6 CCD stellar sensor system.<br />
Later work focused on developing electronic integrated circuitry for micromechanical gyros, accelerometers, and chemical<br />
sensors. He holds four patents in the field of instrumentation. He received SB (1976), SB (1982), and MS (1989) degrees in<br />
Life Sciences, Electrical Engineering, and Engineering Design from MIT and Tufts University.<br />
Flexural Plate Wave Sensor 81
82 2006 Patents Issued<br />
patents<br />
2006<br />
Issued<br />
Anderson, J.M.; Kerrebrock, P.A.; McFarland, W.W.;<br />
Ogrodnik, T.G.<br />
Crawler Device<br />
Patent Number 7,137,465 B1, November 21, 2006<br />
Antkowiak, B.M.; Carter, D.J.; Duwel, A.E.; Mescher,<br />
M.J.; Varghese, M.; Weinberg, M.S.<br />
MEMS Piezoelectric Longitudinal Mode Resonator<br />
Patent Number 7,005,946 B2, February 28, 2006<br />
Coskren, W.D.; Parry, J.R.; Williams, J.R.; Sebelius,<br />
P.W.<br />
Sensor Apparatus and Method of Using Same<br />
Patent Number 7,100,689 B2, September 5, 2006<br />
Elliott, R.D.; Ward, P.A.<br />
Apparatus for and Method of Sensing a Measured<br />
Input<br />
Patent Number 7,055,387 B2, June 6, 2006<br />
Greenspan, R.L.; Przyjemski, J.M.<br />
Method and System for Implementing a Communications<br />
Transceiver Using Modified GPS User<br />
Equipment<br />
Patent Number 7,123,895 B2, October 17, 2006<br />
Hansberry, M.L.; Ash, M.E.; Martorana, R.T.<br />
Multi-Gimbaled Borehole Navigation System<br />
Patent Number 7,093,370 B2, August 22, 2006<br />
Miller, R.A.; Nazarov, E.G.; Eiceman, G.A.; Krylov, E.<br />
Method and Apparatus for Electrospray Augmented<br />
High Field Asymmetric Ion Mobility Spectrometry<br />
Patent Number 7,075,068 B2, July 11, 2006<br />
Miller, R.A.; Nazarov, E.G.; Zapata, A.M.; Davis,<br />
C.E.; Eiceman, G.A.; Bashall, A.D.<br />
Systems for Differential Ion Mobility Analysis<br />
Patent Number 7,057,168 B2, June 6, 2006<br />
Robbins, W.L.; Miller, R.A.<br />
Spectrometer Chip Assembly<br />
Patent Number 7,098,449 B1, August 29, 2006<br />
Weinberg, M.S.; Cunningham, B.T.; Hildebrant, E.M.<br />
Flexural Plate Wave Sensor<br />
Patent Number 7,109,633 B2, September 19, 2006<br />
Williams, J.R.; Cunningham, B.T.<br />
Flexural Plate Wave Sensor and Array<br />
Patent Number 7,000,453 B2, February 21, 2006<br />
Williams, J.R.; Dineen Jr., D.A.; Prince J.R.<br />
Microfluidic Ion-Selective Electrode Sensor System<br />
Patent Number 7,101,472 B2, September 5, 2006
The<br />
performance<br />
2006 <strong>Draper</strong> Distinguished<br />
Awards<br />
DPA Screening Committee<br />
Members<br />
The DPA was established in 1989<br />
and is the most prestigious award<br />
that <strong>Draper</strong> bestows for extraordinary<br />
achievements by individuals<br />
or teams. These achievements must<br />
constitute a major technical accomplishment,<br />
the technical effort must<br />
entail highly challenging work of<br />
substantial benefit to the <strong>Laboratory</strong><br />
and the outside community,<br />
include a recent discrete accomplishment<br />
that is clearly extraordinary<br />
and represents a standard<br />
of excellence for the <strong>Laboratory</strong>,<br />
and the responsible individual or<br />
core team can be identified as the<br />
prime participant(s) in achieving<br />
the significant results. This year’s<br />
committee was chaired by Scott<br />
Uhland. Members included Heather<br />
Clark, Christopher Gibson, Lauren<br />
Kessler, Edward Lanzilotta, David<br />
Owen, Dora Ramos, Elliot Ranger,<br />
and Roger Wilmarth. Administrative<br />
support was provided by Noel<br />
Cassidy.<br />
Chairman of the Board John R. Kreick and then-President Vincent Vitto presented<br />
the 2006 <strong>Draper</strong> Distinguished Performance Awards (DPAs) to a team and to an<br />
individual at the Annual Dinner of the Corporation on October 4, 2006.<br />
Accelerated Delivery of Miniaturized Radio Frequency Communications<br />
Hardware<br />
The Next Generation Fastraker<br />
team members responsible for<br />
hardware achieved production<br />
qualification of the first engineering<br />
model, which was the first<br />
mixed-signal multichip module<br />
ever qualified for production by<br />
<strong>Draper</strong>. Production qualification<br />
occurred earlier than scheduled<br />
and in a package so much smaller<br />
than the sponsor’s specifications<br />
that the overall system size was<br />
reduced by nearly a factor of<br />
three.<br />
Development and Strategic Distribution of a Geospatial Intelligence<br />
Networked System to Middle Eastern Military Force<br />
Harold A. Bussey led the team<br />
that adapted the <strong>Draper</strong>-developed<br />
U.S. Air Force system for<br />
handling geospatial information<br />
for use by NATO forces in<br />
the Middle East. He delivered<br />
the system to users in the field<br />
and trained them in its use. The<br />
system’s usefulness has led other<br />
military organizations to consider<br />
adopting it.<br />
(clockwise from left) Michael T. Clohecy, Vincent J. Attenasio,<br />
Jr., Don A. Black, Michael J. Matranga, John R. Burns III,<br />
Donald I. Schwartz, and (inside center) Valerie H. Lowe<br />
(l-r) President James D. Shields, Award Recipient Harold<br />
A. Bussey, and Chairman of the Board John R. Kreick<br />
The 2006 <strong>Draper</strong> Distinguished Performance Awards 83
Sir Timothy Berners-Lee<br />
84 The 2007 Charles Stark <strong>Draper</strong> Prize<br />
draper<br />
The 2007 Charles Stark<br />
Prize<br />
The Charles Stark <strong>Draper</strong> Prize was established in 1988 to<br />
honor the memory of Dr. Charles Stark <strong>Draper</strong>, “the father<br />
of inertial navigation.” Awarded annually, the Prize was<br />
instituted by the National Academy of Engineering (NAE)<br />
and endowed by <strong>Draper</strong> <strong>Laboratory</strong>. It is recognized as one<br />
of the world’s preeminent awards for engineering achievement<br />
and honors individuals who, like Dr. <strong>Draper</strong>, developed<br />
a unique concept that has contributed significantly to<br />
the advancement of science and technology and the welfare<br />
and freedom of society.<br />
The 2007 Charles Stark <strong>Draper</strong> Prize was presented to Sir Timothy<br />
Berners-Lee at a ceremony on February 20 in Washington,<br />
D.C. According to the NAE, Berners-Lee “imaginatively<br />
combined ideas to create the World Wide Web, an extraordinary<br />
innovation that is rapidly transforming the way people store, access,<br />
and share information around the globe. Despite its short existence,<br />
the Web has contributed greatly to intellectual development and plays<br />
an important role in health care, environmental protection, commerce,<br />
banking, education, crime prevention, and the global dissemination of<br />
information.” In addition, he “demonstrated a high level of technical<br />
imagination in inventing this system to organize and display information<br />
on the Internet.” His innovations include the uniform resource identifier<br />
(URI), HyperText Markup Language (HTML), and HyperText Transfer<br />
Protocol (HTTP).<br />
Photo credit: Bill Truslow<br />
Berners-Lee proposed his concept<br />
for the Web in 1989 while at the<br />
European Organization for Nuclear<br />
Research (CERN), launched it on the<br />
Internet in 1991, and continued to<br />
refine its design through 1993. He<br />
designed the Web with public domain<br />
scalable software and an open architecture<br />
to allow other inventions to<br />
be built on it.<br />
Berners-Lee is currently a senior<br />
researcher and holder of the 3Com<br />
Founders Chair at the Computer<br />
Science and Artificial Intelligence<br />
<strong>Laboratory</strong> at MIT and a professor<br />
of computer science in the School of<br />
Electronics and Computer Science<br />
at the University of Southampton,<br />
UK. He continues to guide the Web’s<br />
evolution as founder and director<br />
of the World Wide Web Consortium<br />
(W3C), an international forum<br />
that develops standards for the<br />
Web. A graduate of Oxford University,<br />
England, he became a fellow of<br />
the Royal Society in 2001. He has<br />
received several international awards,<br />
including the Japan Prize, the Prince<br />
of Asturias Foundation Prize, the<br />
Millennium Technology Prize, and<br />
Germany’s Die Quadriga Award.<br />
Berners-Lee was knighted by Queen<br />
Elizabeth in 2004. He is the author of<br />
“Weaving the Web.”
Recipients of the Charles Stark <strong>Draper</strong> Prize<br />
2006: Willard S. Boyle and George E. Smith for the invention of the charge-coupled device (CCD)<br />
2005: Minoru Araki, Francis J. Madden, Don H. Schoessler, Edward A. Miller, and James W. Plummer<br />
for their invention of the Corona earth-observation satellite technology<br />
2004: Alan C. Kay, Butler W. Lampson, Robert W. Taylor, and Charles P. Thacker for the development<br />
of the world’s first practical networked personal computers<br />
2003: Ivan A. Getting and Bradford W. Parkinson for their technological achievements in the development<br />
of the Global Positioning System<br />
2002: Robert S. Langer for bioengineering revolutionary medical drug delivery systems<br />
2001: Vinton Cerf, Robert Kahn, Leonard Kleinrock, and Lawrence Roberts for their individual<br />
contributions to the development of the Internet<br />
1999: Charles K. Kao, Robert D. Maurer, and John B. MacChesney for development of fiber-optic<br />
technology<br />
1997: Vladimir Haensel for the development of the chemical engineering process of “Platforming”<br />
(short for Platinum Reforming), which was a platinum-based catalyst to efficiently convert<br />
petroleum into high-performance, cleaner-burning fuel<br />
1995: John R. Pierce and Harold A. Rosen for their development of communication satellite<br />
technology<br />
1993: John Backus for his development of FORTRAN, the first widely used, general-purpose, highlevel<br />
computer language<br />
1991: Sir Frank Whittle and Hans J.P. von Ohain for their independent development of the turbojet<br />
engine<br />
1989: Jack S. Kilby and Robert N. Noyce for their independent development of the monolithic integrated<br />
circuit<br />
For information on the nominating process, contact the Awards Office at the National<br />
Academy of Engineering at (202) 334-1266 or http://www.nae.edu/awards.<br />
The 2007 Charles Stark <strong>Draper</strong> Prize 85
Laura Forest<br />
The 2006 Howard Musoff Student Mentoring Award was presented to<br />
Laura Forest, a Human-System Collaboration Engineer in the Software<br />
System Architectures and Human-Computer Interfaces (HCI) Department.<br />
When asked about the importance of mentoring activities, Laura<br />
remarked, “It has been very rewarding to mentor and work with <strong>Draper</strong> <strong>Laboratory</strong><br />
Fellows (DLF) and other student interns. I have especially enjoyed witnessing the<br />
students’ transformation as they step from undergraduate classroom-based problem<br />
solving to the broader scope of engineering research and subsequent publishing.<br />
Seeing the students take the knowledge and experience I share with them and<br />
use it for their own growth is truly fulfilling. Mentoring can also establish life-long<br />
contacts and friendships – I’m planning on attending one of my former DLF’s<br />
wedding in Reno, NV, this summer. Additionally, the students contribute to my<br />
own professional development through the research areas they explore, the leadership<br />
opportunities they present, and the associated expansion of my academic<br />
contacts. I look forward to continuing mentoring relationships in the future.”<br />
86 The 2006 Howard Musoff Student Mentoring Award<br />
mentoring<br />
The 2006 Howard Musoff Student<br />
Award<br />
In addition to her mentoring activities at<br />
<strong>Draper</strong>, for the past two years, Laura has<br />
been a volunteer with Science Club for<br />
Girls, a weekly after-school program in<br />
Cambridge. Volunteers perform a variety<br />
of science experiments with the girls and<br />
discuss their careers as scientists.<br />
Laura’s primary research interests include<br />
cognitive engineering, human-guided<br />
algorithms, human factors, and HCI. She is<br />
currently working on projects that include<br />
research on human-guided algorithms,<br />
spacecraft automation for lunar landing,<br />
decision support for intelligence analysts,<br />
and requirements for facial recognition<br />
systems. A member of the Human Factors<br />
and Ergonomics Society (HFES), Society of<br />
Women Engineers (SWE), IEEE, and AIAA,<br />
Laura has a BS in Industrial and Systems<br />
Engineering from Georgia Tech and an MS<br />
in Aeronautics and Astronautics from MIT.<br />
The Howard Musoff Mentoring Award<br />
was established in his memory in 2005.<br />
A <strong>Draper</strong> employee for more than 40<br />
years, Musoff advised and mentored<br />
many <strong>Draper</strong> Fellows. This award is given<br />
each February during National Engineers<br />
Week and recognizes staff members who,<br />
as Musoff did, share their expertise and<br />
supervise the professional development<br />
and research activities of <strong>Draper</strong> Fellows.<br />
The award, endowed by the Howard<br />
Musoff Charitable Foundation, includes<br />
a $1,000 honorarium and a plaque. <strong>Each</strong><br />
Engineering Division Leader may submit<br />
one nomination of a staff person from his<br />
Division. The Education Office assists in<br />
the process by soliciting comments from<br />
students who were residents during that<br />
time period. The Selection Committee<br />
consists of the Vice President of Engineering,<br />
the Principal Director of Engineering,<br />
and the Director of Education.
esearch<br />
2006 Graduate<br />
Theses<br />
During 2006, the <strong>Draper</strong> Fellow Program served 65 students from MIT and several other universities. Abstracts of theses<br />
completed this year are available on the <strong>Laboratory</strong>’s web site at www.draper.com. The list of completed theses follows:<br />
Anderson, A.D.; Supervisors: Gustafson, D.E.; Deyst, J.<br />
Recovering Sample Diversity in Rao-Blackwellized<br />
Particle Filters for Simultaneous Localization and<br />
Mapping<br />
Master of Science Thesis, MIT, June 2006<br />
Bairstow, S.H.; Supervisors: Barton, G.H.; Deyst, J.J.<br />
Reentry Guidance with Extended Range Capability for<br />
Low L/D Spacecraft<br />
Master of Science Thesis, MIT, February 2006<br />
Barker, D.R.; Supervisors: Singh, L.; How, J.<br />
Robust Randomized Trajectory Planning for Satellite<br />
Attitude Tracking Control<br />
Master of Science Thesis, MIT, June 2006<br />
Beaton, J.S.; Supervisors: Dever, C.W.; Appleby, B.D.<br />
Human Inspiration for Autonomous Vehicle Tactics<br />
Master of Science Thesis, MIT, May 2006<br />
Bryant, C.H.; Supervisors: Armacost, A.P.; Abramson,<br />
M.R.; Kolitz, S.E.; Barnhart, C.<br />
Robust Planning for Effects-Based Operations<br />
Master of Science Thesis, MIT, June 2006<br />
Chau, D.; Supervisors: Racine, R.J.; Liskov, B.<br />
Authenticated Messages for a Real-Time Fault-Tolerant<br />
Computer System<br />
Master of Engineering Thesis, MIT, September 2006<br />
Earnest, C.A.; Supervisors: Dai, L.; Page, L.A.; Roy, N.;<br />
Barnhart, C.<br />
Dynamic Action Spaces for Autonomous Search<br />
Operations<br />
Master of Science Thesis, MIT, March 2006<br />
Harjes, D.I.; Supervisors: Clark, H.A.; Kamm, R.D.<br />
High Throughput Optical Sensor Arrays for Drug<br />
Screening<br />
Master of Science Thesis, MIT, September 2006<br />
Jimenez, A.R.; Supervisors: Kaelbling, L.P.; DeBitetto, P.A.<br />
Policy Search Approaches to Reinforcement Learning<br />
for Quadruped Locomotion<br />
Master of Engineering Thesis, MIT, May 2006<br />
Krenzke, T.P.; Supervisors: McConley, M.W.; Appleby, B.D.<br />
Ant Colony Optimization for Agile Motion Planning<br />
Master of Science Thesis, MIT, June 2006<br />
McAllister, D.B.; Supervisors: Kahn, A.C.; Kaelbling, L.P.;<br />
Jaillet, P.<br />
Planning with Imperfect Information: Interceptor<br />
Assignment<br />
Master of Science Thesis, MIT, June 2006<br />
Mihok, B.E.; Supervisors: Miller, J.W.; Appleby, B.D.<br />
Property-Based System Design Method with Application<br />
to a Targeting System for Small UAVs<br />
Master of Science Thesis, MIT, June 2006<br />
Parikh, K.M.; Supervisors: Weinberg, M.S.; Freeman, D.M.<br />
Modeling the Electrical Stimulation of Peripheral<br />
Vestibular Nerves<br />
Master of Engineering Thesis, MIT, September 2006<br />
Ren, B.B.; Supervisors: Keshava, N.; Freeman, D.<br />
Calibration, Feature Extraction and Classification of<br />
Water Contaminants Using a Differential Mobility<br />
Spectrometer<br />
Master of Engineering Thesis, MIT, May 2006<br />
Sakamoto, P.; Supervisors: Armacost, A.P.; Kolitz, S.E.;<br />
Barnhart, C.<br />
UAV Mission Planning Under Uncertainty<br />
Master of Science Thesis, MIT, June 2006<br />
Schaaf, B.T.; Supervisors: Andrews, G.L.; Appleby, B.D.<br />
Using Learning Algorithms to Develop Dynamic Gaits<br />
for Legged Robots<br />
Master of Science Thesis, MIT, June 2006<br />
Smith, C.A.; Supervisors: Cummings, M.L.; Forest, L.M.<br />
Ecological Perceptual Aid for Precision Vertical<br />
Landings<br />
Master of Science Thesis, MIT, June 2006<br />
Smith, T.B.; Supervisors: Nervegna, M.F.; Barnhart, C.<br />
Decision Algorithms for Unmanned Underwater<br />
Vehicles During Offensive Operations<br />
Master of Science Thesis, MIT, June 2006<br />
Springmann, P.N.; Supervisors: Proulx, R.J.; Deyst, J.J.<br />
Lunar Descent Using Sequential Engine Shutdown<br />
Master of Science Thesis, MIT, January 2006<br />
Sterling, R.M.; Supervisors: Racine, R.J.; Liskov, B.H.<br />
Synchronous Communication System for a Software-<br />
Based Byzantine Fault-Tolerant Computer<br />
Master of Science Thesis, MIT, August 2006<br />
Swanton, D.R.; Supervisors: Brown, R.A.; Kaelbling, L.P.<br />
Integrating Timeliner and Autonomous Planning<br />
Master of Science Thesis, MIT, August 2006<br />
Teahan, G.O.; Supervisors: Paschall II, S.C.; Battin, R.H.<br />
Analysis and Design of Propulsive Guidance for Atmospheric<br />
Skip Entry Trajectories<br />
Master of Science Thesis, MIT, June 2006<br />
Thrasher, S.W.; Supervisors: Dever, C.W.; Deyst, J.J.<br />
Reactive/Deliberative Planner Using Genetic Algorithms<br />
on Tactical Primitives<br />
Master of Science Thesis, MIT, June 2006<br />
Varsanik, J.S.; Supervisors: Duwel, A.E.; Kong, J-A<br />
Design and Analysis of MEMS-Based Metamaterials<br />
Master of Engineering Thesis, MIT, June 2006<br />
2006 Graduate Research Theses 87
2006<br />
technology<br />
Exposition<br />
<strong>Each</strong> year, <strong>Draper</strong> hosts a Technology Exposition (Tech<br />
Expo) to showcase recent projects and highlight the<br />
<strong>Laboratory</strong>’s core competencies. Held on October<br />
4-5 to coincide with the fall meeting of <strong>Draper</strong>’s<br />
Board of Directors and the Annual Meeting of the Corporation,<br />
guests included employees and Corporation members,<br />
students from local universities and Cambridge public schools,<br />
and sponsors.<br />
The exhibits featured developing technologies in the <strong>Laboratory</strong>’s<br />
program areas: strategic, tactical, space systems, special<br />
operations, biomedical engineering, and independent research<br />
and development. The exhibits also reflected the <strong>Laboratory</strong>’s<br />
core competencies: guidance, navigation, and control; embedded,<br />
real-time software; microelectronics and packaging;<br />
autonomous systems; distributed systems; microelectromechanical<br />
systems; biomedical engineering; and prototyping<br />
system solutions. In coordination with <strong>Draper</strong>’s Education<br />
Office, many projects also included graduate or undergraduate<br />
students on their teams.<br />
<strong>Draper</strong>’s subsidiary venture capital fund, Navigator Technology<br />
Ventures, LLC (NTV), displayed information about a number<br />
of its portfolio companies. These companies include Actuality<br />
Systems, Aircuity, Assertive Design, Food Quality Sensor (FQS)<br />
International, HistoRx, Polnox Corp., Polychromix, Renalworks<br />
Medical Corp., Sionex Corp., and Tizor Systems.<br />
Linda Fuhrman shares her enthusiasm for space<br />
exploration and <strong>Draper</strong>’s role with Cambridge<br />
public school students.<br />
88 2006 Technology Exposition<br />
Ray Barrington (left) and Stephen Smith<br />
(center) discuss <strong>Draper</strong>’s Space Programs<br />
with an interested visitor.<br />
Malinda Tupper demonstrates one of several<br />
biological/chemical sensors under development<br />
as <strong>Draper</strong> continues to pursue the<br />
smallest, most robust, and selective electronic<br />
detection platforms.<br />
Roger Wilmarth (left) and a <strong>Draper</strong> Fellow<br />
discuss innovations in small robotics systems<br />
for surveillance and rescue operations, including<br />
precision airdrop systems, small undersea<br />
vehicles, and systems designed to overcome<br />
difficult mobility challenges.
#*<br />
The Charles Stark <strong>Draper</strong> <strong>Laboratory</strong>, Inc.<br />
555 Technology Square<br />
Cambridge, MA 02139-3563<br />
Phone: (617) 258-1000<br />
www.draper.com<br />
Business Development<br />
busdev@draper.com<br />
Phone: (617) 258-2124<br />
Washington<br />
Suite 501<br />
1555 Wilson Boulevard<br />
Arlington, VA 22209<br />
Phone: (703) 243-2600<br />
Houston<br />
Suite 470<br />
17629 El Camino Real<br />
Houston, TX 77058<br />
Phone: (281) 212-1101