Skip to content
New issue

Have a question about this project? Sign up for a free GitHub account to open an issue and contact its maintainers and the community.

By clicking “Sign up for GitHub”, you agree to our terms of service and privacy statement. We’ll occasionally send you account related emails.

Already on GitHub? Sign in to your account

Gauge - Anticlockwise #11080

Closed
MohammadYounes opened this issue Aug 22, 2019 · 9 comments
Closed

Gauge - Anticlockwise #11080

MohammadYounes opened this issue Aug 22, 2019 · 9 comments
Labels
bug difficulty: easy Issues that can be fixed more easily than the average. en This issue is in English topic: gauge

Comments

@MohammadYounes
Copy link

Version

4.2.1

Steps to reproduce

Create a gauge with the following option

option = {
    series: [
        {
            type: 'gauge',
            detail: {formatter:'{value}%'},
            data: [{value: 50}],
            min:0,
            max:100,
            startAngle:0,
            endAngle:180,
            clockwise:false //anitclockwise
        }
     ]
}

anticlockwise

However, setting clockwise to true breaks the axis line.

option = {
    series: [
        {
            type: 'gauge',
            detail: {formatter:'{value}%'},
            data: [{value: 50}],
            min:0,
            max:100,
            startAngle:0,
            endAngle:180,
            clockwise:true
        }
     ]
}

anti-anticlockwise

What is expected?

The gauge to be created anticlockwise along with the pointer animation.

What is actually happening?

Both the gauge and pointer animation are clockwise.


The only way I could make it anticlockwise was by swapping min/max and startAngle/endAngle. But unfortunately, the pointer animation remained clockwise.

option = {
    series: [
        {
            type: 'gauge',
            detail: {formatter:'{value}%'},
            data: [{value: 50}],
            min:100,
            max:0,
            startAngle:180,
            endAngle:0,
            clockwise:true
        }
    ]
}

clockwise

@echarts-bot
Copy link

echarts-bot bot commented Aug 22, 2019

Hi! We've received your issue and please be patient to get responded. 🎉
The average response time is expected to be within one day for weekdays.

In the meanwhile, please make sure that you have posted enough image to demo your request. You may also check out the API and chart option to get the answer.

If you don't get helped for a long time (over a week) or have an urgent question to ask, you may also send an email to dev@echarts.apache.org .

If you are interested in the project, you may also subscribe our mail list.

Have a nice day! 🍵

@echarts-bot echarts-bot bot added bug en This issue is in English pending We are not sure about whether this is a bug/new feature. waiting-for-help labels Aug 22, 2019
@yufeng04
Copy link
Contributor

clockwise represents the growth direction of scale values on the gauge

@Ovilia
Copy link
Contributor

Ovilia commented Aug 29, 2019

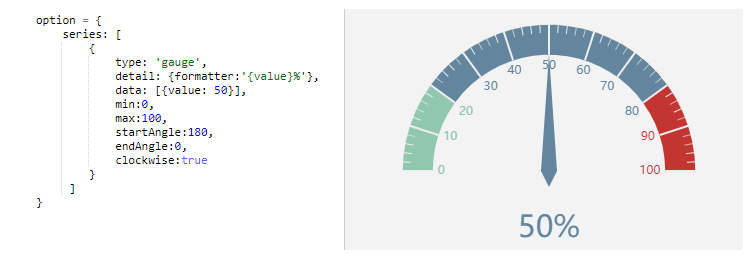
This doesn't seem to be a bug. I think you should use the following code when setting clockwise to be true:

option = {
    series: [
        {
            type: 'gauge',
            detail: {formatter:'{value}%'},
            data: [{value: 50}],
            min:0,
            max:100,
            startAngle:180,
            endAngle:0,
            clockwise:true
        }
     ]
}

@Ovilia Ovilia added support waiting-for-author and removed bug pending We are not sure about whether this is a bug/new feature. waiting-for-help labels Aug 29, 2019
@MohammadYounes
Copy link
Author

@Ovilia I need the scale to be anticlockwise.

Your suggested option gives this:

image

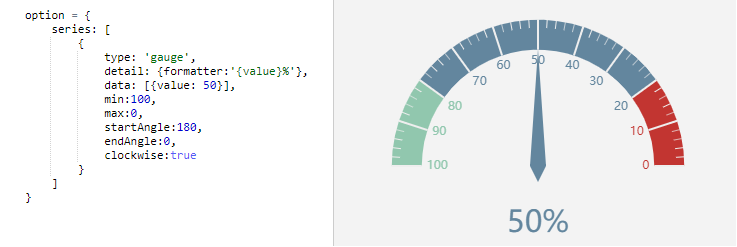
What I need is this:

image

@Ovilia
Copy link
Contributor

Ovilia commented Aug 29, 2019

I think it's a bug with

option = {
    series: [
        {
            type: 'gauge',
            detail: {formatter:'{value}%'},
            data: [{value: 50}],
            min:0,
            max:100,
            startAngle:0,
            endAngle:180,
            clockwise:false
        }
     ]
}

@javio2
Copy link

javio2 commented Sep 3, 2020

Hi,
I've found a related issue. The pointer points the proper value but it maintains the clockwise color.
gauge-clock-anticlock
I also toggled min/max and startAngle/endAngle values

@github-actions
Copy link
Contributor

github-actions bot commented Sep 4, 2022

This issue has been automatically marked as stale because it did not have recent activity. It will be closed in 7 days if no further activity occurs. If you wish not to mark it as stale, please leave a comment in this issue.

@github-actions github-actions bot added the stale Inactive for a long time. Will be closed in 7 days. label Sep 4, 2022
@Ovilia Ovilia removed the stale Inactive for a long time. Will be closed in 7 days. label Sep 5, 2022
@Ovilia Ovilia added this to the TBD milestone Sep 5, 2022
@Ovilia Ovilia added the difficulty: easy Issues that can be fixed more easily than the average. label Sep 5, 2022
@echarts-bot
Copy link

echarts-bot bot commented Sep 5, 2022

This issue is labeled with difficulty: easy.
@MohammadYounes Would you like to debug it by yourself? This is a quicker way to get your problem fixed. Or you may wait for the community to fix.

Please have a look at How to debug ECharts if you'd like to give a try. 🤓

@Ovilia
Copy link
Contributor

Ovilia commented Apr 20, 2023

Seems to be fixed.

@Ovilia Ovilia closed this as completed Apr 20, 2023
@Ovilia Ovilia removed this from the TBD milestone Apr 20, 2023
Sign up for free to join this conversation on GitHub. Already have an account? Sign in to comment
Labels
bug difficulty: easy Issues that can be fixed more easily than the average. en This issue is in English topic: gauge
Projects
None yet
Development

No branches or pull requests

4 participants