A car's dashboard displays vital information in an easily understandable format, assists in decision-making, and alerts the driver to potential issues. (Although the check engine light, with the specificity of a horoscope, treats a loose gas cap and a full-system meltdown with the same level of urgency.)
Like a car's dashboard, an Excel KPI dashboard shows you the vital signs of your business, but without the cryptic hints and not-so-subtle threats—just cold, hard data served up in a way that's easy to digest.
In this post, I'll go over what KPI dashboards are and how to build one in Excel. I'm even sharing some templates you can use to jumpstart performance tracking for your business.
Table of contents:
What is a KPI dashboard—and why build one in Excel?
An Excel KPI dashboard is a visual representation of your key performance indicators (KPIs), giving you a bird's-eye view of what's working and what's not. KPIs are metrics an organization has identified as critical to measuring its performance.
But why a dashboard? Well, trying to navigate large datasets without visuals is like asking a young person to explicitly describe Fortnite dances using only words. A KPI dashboard presents complex data in an easily digestible format, often using charts, graphs, and tables. This perspective allows you to see the big picture, highlighting the elements that contribute to the overall mission while filtering out the noise.
With a good dashboard, you'll be able to:
Recognize patterns that might otherwise go unnoticed
Determine how close you are to meeting your goals and whether they need to be revised
Spot and address potential issues early
Benchmark performance against industry standards or competitor data to gauge progress and address weaknesses
Spot trends to better forecast future performance
A note on using spreadsheets: Spreadsheets are fine when you're small. But once you hit about 100 customers, it starts getting messy. Even upgrading to a database can make a huge difference: you'll have better logs of what changed and when, and it offers more options for segmentation.
Create a comprehensive KPI dashboard in Excel in 3 easy steps
If building a KPI dashboard in Excel sounds like something that'll make you weep quietly into your coffee, prepare to be very surprised. I'm about to walk through the whole process in three surprisingly simple steps.
Step 1: Identify your KPIs and prepare your data
First, select KPIs: A KPI dashboard isn't just a bunch of pretty charts—it's about getting the right info to the right people. So, before you start getting your hands dirty in Excel, think about who will be looking at this thing and what they need to know. For instance, if you're tracking customer acquisitions, maybe leave out the office supply inventory numbers (unless that's your secret weapon).
To help determine your KPIs, ask yourself questions like:
What's the purpose of this dashboard? For example, is it to give stakeholders visibility into their most important metrics like revenue, traffic, and conversions?
What insights do I need to gain? For example, do you need historical data to identify trends over time?
How can I measure progress? For example, are there specific metrics such as customer satisfaction scores, production efficiency, or sales growth that need to be tracked regularly to evaluate the success of business strategies?
What metrics will help leadership make better decisions? For example, leaders might need detailed reports on cost efficiency, employee productivity, or customer retention rates to make informed strategic decisions.
Choose KPIs that provide a clear and actionable snapshot of performance based on your business goals and objectives. Here are some Zapier guides on selecting KPIs to get you started:
Next, collect data. Once you've identified your KPIs, you'll have to gather the raw data needed to calculate them. Pull reports, export databases, beg your analysts for access—whatever it takes to get your hands on the numbers and figures.
With your data in hand, import it into Excel:
Go to the Data tab on the ribbon.
Choose Get Data (Power Query).
Select your data source, and follow the prompts to import your data.


Finally, clean and organize your data. Now it's time to wrangle your data into submission. Remove any duplicates or errors. Use formulas like SUM(), AVERAGE(), or COUNTIF() to calculate KPI values from the raw data. Format cells, columns, and rows to make the numbers easy to parse at a glance.
Step 2: Choose visualizations
First, select charts and graphs. Look at your data and consider what you want to emphasize. Are you tracking changes over time? Comparing values across categories? Illustrating proportions?
The type of chart or graph you select depends on what you want to convey. Think about your audience and what will be most useful for them. Keep experimenting with different charts and layouts until you find one that brings your key metrics to life.
To create a chart:
Select the data you want to visualize. For example, if you're visualizing sales data, select the range that includes your sales figures and corresponding dates or categories.
Go to the Insert tab on the ribbon.
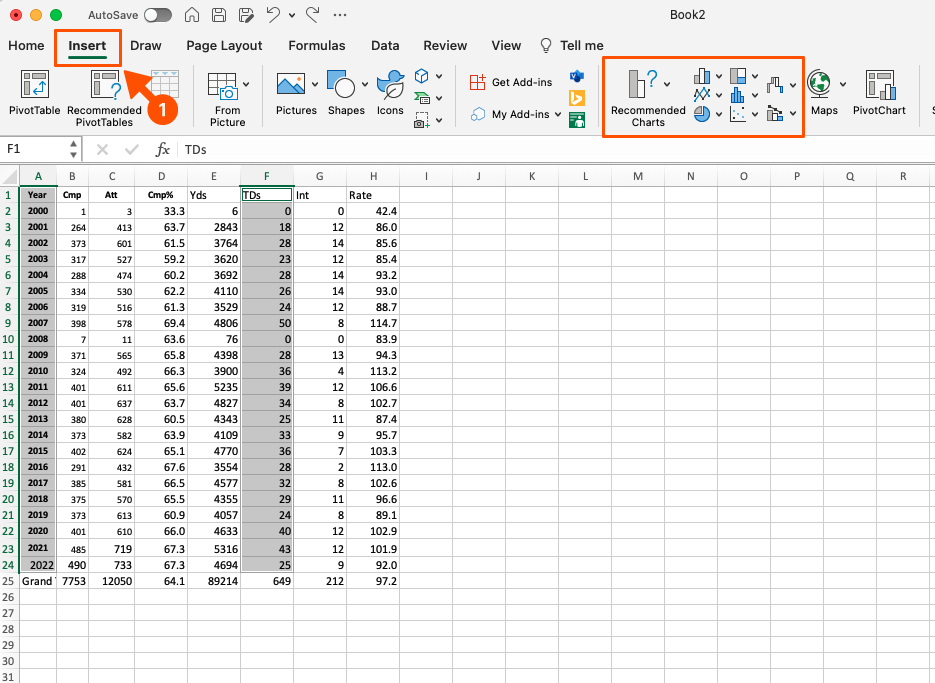
Choose a chart type that best represents your data (column, line, pie, bar, etc.)

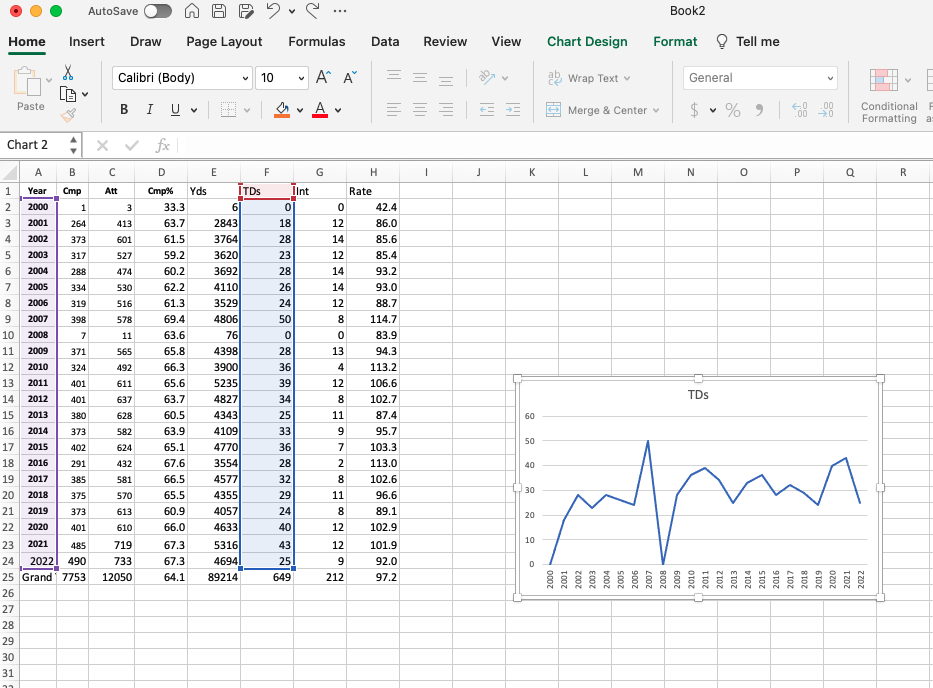


Add more charts as needed by repeating the above steps for the rest of your KPIs.
Chart type | Description | When to use it |
|---|---|---|
Column chart | Vertical bars showing data changes over a period or comparisons among items | Comparing data across categories |
Bar chart | Horizontal bars; similar to column charts but horizontal | Comparing many categories |
Line chart | Displays information as a series of data points connected by straight lines | Showing trends over time |
Pie chart | Circular chart divided into sections that illustrate numerical proportion | Showing parts of a whole |
Area chart | Similar to a line chart but with the area below the line filled in | Showing cumulative totals over time |
Scatter (XY) chart | Shows the relationship between two sets of data | Showing correlations |
Bubble chart | Variation of a scatter chart with data points replaced by bubbles | Comparing sets of three data points |
Surface chart | Displays trends using two dimensions on a continuous curve | Finding optimal combinations |
Doughnut chart | Similar to a pie chart but with a hole in the middle | Showing multiple data series |
Radar chart | Displays multivariate data in the form of a two-dimensional chart | Showing performance metrics |
Waterfall chart | Shows a running total as values are added or subtracted | Understanding the cumulative effect of sequentially introduced positive or negative values |
Step 3: Lay out the dashboard
First, design the structure. Arrange the charts in a visually appealing and informative manner. A simple three-column grid is a great place to begin. This makes the dashboard a breeze to navigate and gives it a professional polish.
Place your most important KPI chart in the top-left, as this is where people naturally look first. Move and resize the chart as needed by dragging it around.
Next, customize chart elements: Jazz up your chart with a title, clear labels, and custom colors in the Chart Design tab.
Finally, ensure readability. A good dashboard should be easy on the eyes. Use colors and fonts that make the data easy to digest. Adjust the layout to ensure all elements are intuitive and aesthetically pleasing.
Additional tips
Here are a few tips to consider for a user-friendly layout:
Keep it simple: An overly complex dashboard with too much information is like modern art—it looks important, but nobody really gets it. If the data doesn't support your dashboard's core purpose, leave it out. Otherwise, it will overwhelm users and reduce its effectiveness.
Update consistently: What's the point of tracking KPIs if the data is stale? Commit to updating your dashboard regularly, or its usefulness will drop faster than my interest in going for a hike when couches exist. Develop a schedule to regularly refresh your dashboard with the latest data, and automate data imports and updates whenever possible.
Explore advanced features: Excel offers many features to enhance your KPI dashboard, such as:
Conditional formatting to highlight important metrics
Data validation for dropdown lists
Sparklines to create visualizations within a cell
Pivot tables to provide an interactive summary of your data
Get feedback and iterate: Once your dashboard is looking stylish, review how the information flows. Are your charts in a logical order? Does anything look out of place? Get a fresh set of eyes to review and provide feedback. Make any final tweaks to ensure maximum readability and impact.
Leverage automation: Automate your Excel dashboard with Zapier if you think sitting in front of a spreadsheet all day is as exciting as it sounds. Set up Zaps to automatically refresh your data, update charts on a schedule, email status reports, and more. Here are some examples.
Add new Jotform submissions to Excel spreadsheet rows
Zapier is a no-code automation tool that lets you connect your apps into automated workflows, so that every person and every business can move forward at growth speed. Learn more about how it works.
Free Excel KPI dashboard templates
There's nothing like poring over datasets and analytics reports to make the hours fly by. Luckily, I am bestowing on you my finest KPI dashboard templates.
While Excel dashboard templates can work wonders, they do have some limitations. You still need to enter your data accurately and keep records to back it all up. And depending on the size of your business, you may outgrow a simple Excel template. But for many small companies, these dashboards are a great way to get insight into how you're doing without a huge time investment.
Marketing analytics KPI dashboard Excel template

An Excel marketing analytics dashboard template gives you an overview of how your marketing efforts are performing. This dashboard visualizes data, helping marketers identify trends, assess the effectiveness of different channels, and make data-driven decisions. It's the perfect tool to determine if your dank memes and sponcon are moving the needle.
Best for tracking:
Website traffic: Tracking the number of visitors to your website can offer insights into your site's overall appeal and the effectiveness of your marketing efforts in drawing an audience.
Conversion rate: This shines a light on the percentage of visitors who take a desired action on your site, be it making a purchase, signing up for a newsletter, or filling out a contact form. It's a telltale sign of how well your website turns casual browsers into committed action-takers.
Cost per acquisition (CPA): This calculates the cost involved in acquiring a new customer through a specific marketing campaign or channel.
Return on ad spend (ROAS): Measuring the revenue generated for every dollar spent on advertising can serve as a barometer for the effectiveness of your campaigns. It tells you if the money you threw at ads turned into more money or just vanished into thin air.
Customer lifetime value (CLTV): Predicts the total revenue a single customer is expected to generate over the course of their relationship with your brand
Sales performance KPI dashboard Excel template

A sales performance KPI dashboard template in Excel is your handy visual guide to how your business is really doing. It helps sales managers monitor and analyze sales activities, identify trends, and pinpoint areas for improvement. Use this KPI report to see at a glance if you're killing your quotas or need to make some changes before the quarter ends in flames.
Best for tracking:
Sales revenue: This is the total amount of money generated from sales over a given period. Compare revenue month-over-month or year-over-year to determine growth and trends.
Sales volume: This is the total number of units sold. Monitor if sales volume is meeting targets and how it changes over time. Volume is a key revenue driver, so keep an eye on this KPI.
Customer acquisition cost (CAC): This measures the cost of acquiring a new customer. Unlike CPA, CAC provides a broader view of acquisition costs, encompassing all marketing and sales activities.
Sales cycle length: Tracking how long it takes to turn a potential lead into a closed deal can provide insights into whether your sales process is more of a sprint or a leisurely stroll.
Win rate: This is the percentage of sales opportunities that turn into wins. It's essentially your sales team's batting average. A higher win rate means your team is knocking it out of the park more often.
Customer service KPI dashboard Excel template

A customer service KPI dashboard template in Excel provides an at-a-glance view of your support team's most important metrics, allowing you to monitor and improve customer service. It helps ensure your agents meet key targets and provide the best service possible.
Customer service is the lifeblood of any company. Keeping a close eye on those KPIs regularly can mean the difference between delighted customers and those whose scathing online reviews turn your brand's reputation into a cautionary tale.
Best for tracking:
Customer satisfaction (CSAT): This measures how satisfied customers are with your product or service, usually through a quick survey asking them to rate their experience. Aim for a score of four or above. If the score drops below 3.5, investigate what's causing dissatisfaction and make changes.
Net Promoter Score (NPS): This gauges customer loyalty and enthusiasm, determined by asking customers how likely they are to recommend your business to a friend. Basically, it's a measure of how likely your customers are to brag about your company at parties.
Resolution time: This measures the average time from when a customer first contacts support to when their issue is resolved. Longer times could indicate staffing shortages or more complex issues that need escalation.
First contact resolution (FCR): This tracks the percentage of customer issues resolved on the first contact. If you aren't meeting this KPI, look for ways to simplify processes or provide additional resources to support reps.
Churn rate: This is the percentage of customers who stop doing business with you over a period of time. It's the not-so-fun metric that tells you how many customers have broken up with you.
Retail management KPI dashboard Excel template

A retail management KPI dashboard template for Excel gives you a high-level view of your shop's health and areas for improvement so you can make data-driven decisions to boost sales, cut costs, and provide the best customer experience. If numbers start to slip into the danger zone, take action before you end up on the wrong end of a "going out of business" sale.
Best for tracking:
Online to real-life traffic and conversion: This tracks how effectively your online presence, like ads or social media campaigns, draws customers into your physical stores and converts those visits into sales.
Return rate: This measures the percentage of products that boomerang back to you after purchase. It's a reality check on product satisfaction, quality, and potential gaps in customer expectations versus reality.
Average deal size: This calculates the average value of each sale, giving you a glimpse into whether your customers are just nibbling on small purchases or going for the big-ticket items.
Sales by contact method: This measures the percentage of sales generated by each contact method, such as email, phone, or in-person visit, highlighting customer preferences and the effectiveness of each contact strategy.
Shrinkage: This is the not-so-magical act of inventory disappearing due to theft, damage, or errors.
Financial KPI dashboard Excel template

Financial KPI dashboards aren't exactly the stuff of action movies. But if you want to keep your company from going belly-up, you've got to keep an eye on the numbers. This Excel KPI dashboard template provides an overview of your company's key financial metrics, allowing you to monitor financial health and spot potential issues.
Best for tracking:
Gross margin: Measures the difference between revenue and cost of goods sold (COGS), expressed as a percentage.
Profit margin: The ultimate litmus test of your company's financial health, profit margin tells you what percentage of sales has transformed into profits.
Cash flow: Tracks the amount of cash coming in and going out of a business. It's the financial equivalent of monitoring your hydration level—too little, and your business could be gasping for liquidity.
Return on investment (ROI): Reveals the effectiveness of your investments by comparing the net profit to the cost of the investment. It effectively calculates how much bang you're getting for your buck.
Debt-to-equity ratio: Compares a company's total liabilities to its shareholder equity and is used to evaluate its financial leverage. It reveals how much of your business is financed by debt versus what you actually own.
Supercharge your KPI Excel dashboard with automation
Using Zapier to automate Excel can significantly streamline the process of creating and updating KPI dashboards. With Zapier, you can automate data collection, ensuring your dashboards are always up-to-date with minimal manual intervention. This integration saves time and enhances the accuracy and efficiency of your data management, making Excel KPI dashboards a more powerful and less soul-sucking part of your job. Learn more about how to automate Excel.
While KPI dashboards may not be the most exciting part of your job, they are essential. A good KPI dashboard gives you transparency and insight into your organization's performance, so you can make improvements, reduce churn, and increase loyalty and lifetime value. And that means very good things for your business's bottom line.
Related reading: